Introduction
What Maple is, what it includes, and how to send your first telemetry.
Maple is an observability platform built on OpenTelemetry. Your applications send traces, logs and metrics over OTLP, the protocol every OpenTelemetry SDK already speaks, and Maple stores them and lets you query, chart and alert on them. There is no proprietary agent to install.
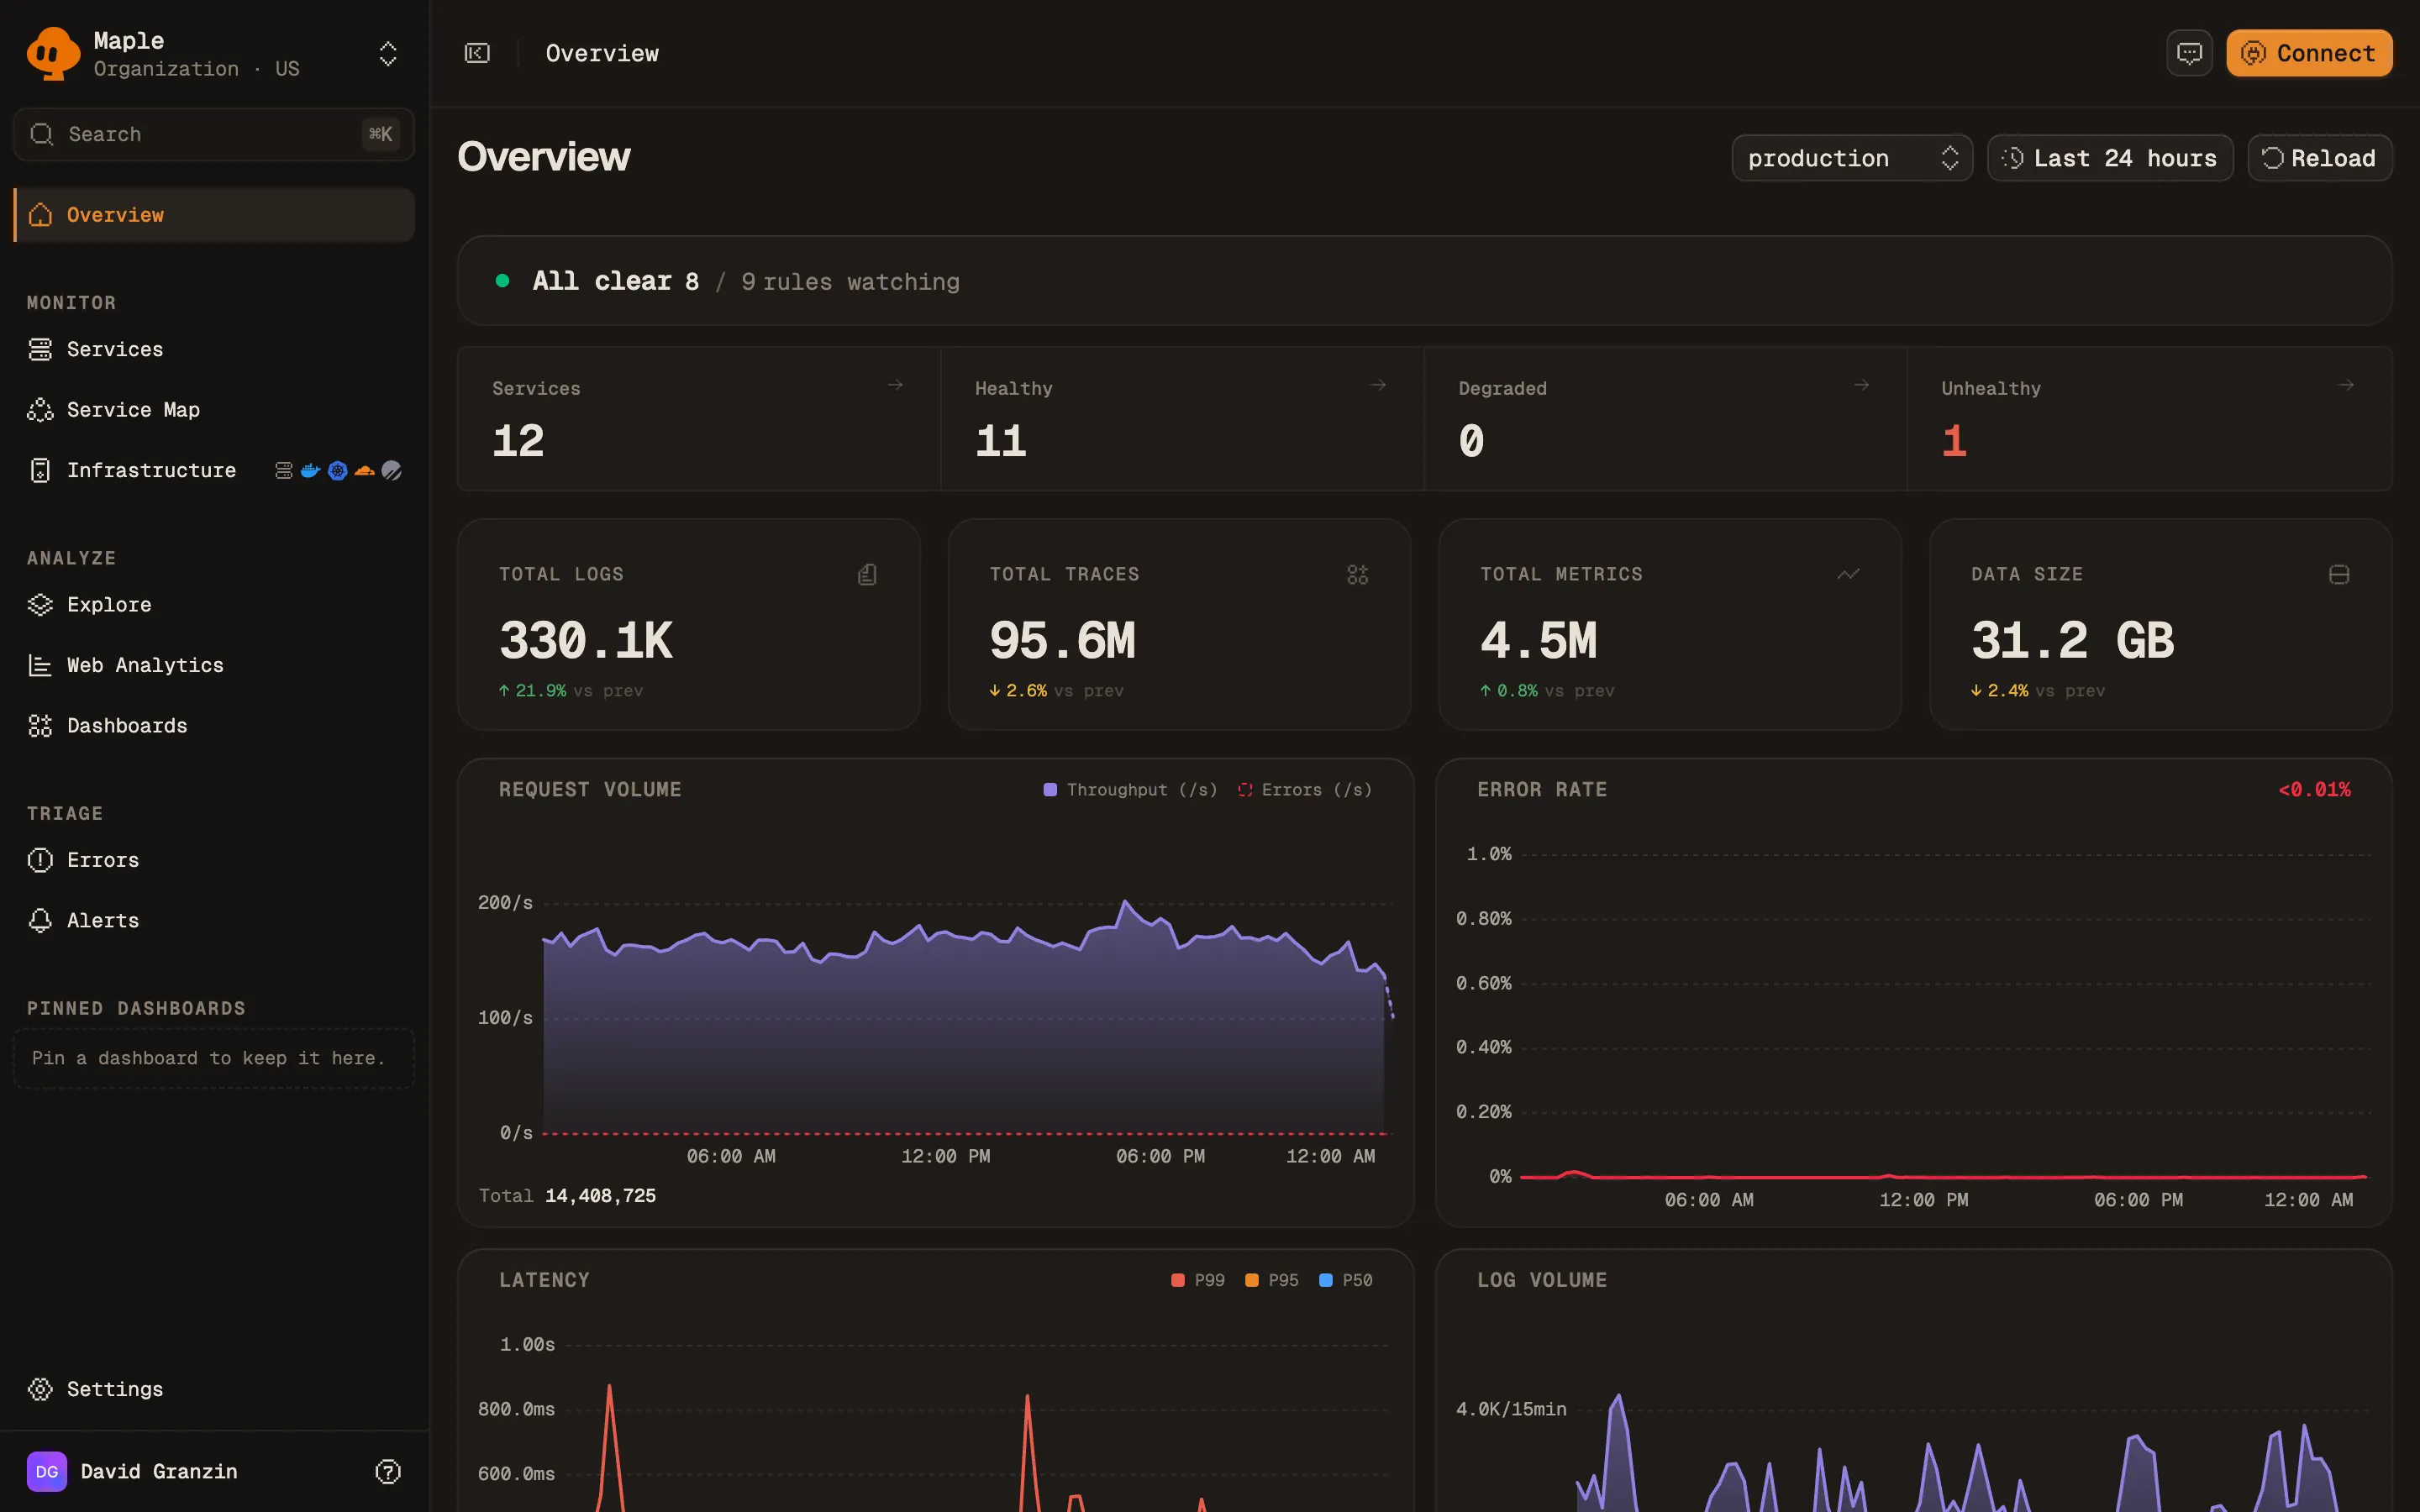
What’s in Maple
- Traces: search spans and open a trace to see every span in it.
- Logs: search logs and jump from a log line to the trace that produced it.
- Metrics: browse and chart the metrics your services export.
- Services: throughput, error rate and latency per service.
- Service map: the calls between your services, built from trace data.
- Errors: exceptions grouped into issues that you can assign and track to done.
- Alerts: rules on any signal, with notifications to your destinations.
- Dashboards: charts and tables built from queries.
- Replays: recordings of browser sessions, linked to their traces.
- Web analytics: page views and visitors from the browser SDK.
- Agent Sessions: AI agent conversations, with every model call and tool call.
- Infrastructure: Hosts, Kubernetes, Containers, Cloudflare and PlanetScale.
Getting started
For a copy-paste walkthrough, including a curl command that sends a test span without an SDK, follow the Quickstart. The short version:
-
Sign up at app.maple.dev. During onboarding you pick the region your organization lives in (US or EU).
-
Open Settings → Ingestion and copy an ingest key. Use the private key (
maple_sk_…) for server applications and the public key (maple_pk_…) for browser code. -
Point an OpenTelemetry SDK at the ingest endpoint for your region:
Region Ingest endpoint United States https://ingest.maple.devEuropean Union https://ingest.eu.maple.devA key only works in the region it was created in. See Regions.
-
Send a request to your application, then open Explore → Traces in Maple and check that a trace for it appears.
With the standard OpenTelemetry environment variables, step 3 looks like this:
export OTEL_EXPORTER_OTLP_ENDPOINT="https://ingest.maple.dev"   # EU: https://ingest.eu.maple.dev
export OTEL_EXPORTER_OTLP_PROTOCOL="http/protobuf"
export OTEL_EXPORTER_OTLP_HEADERS="Authorization=Bearer YOUR_INGEST_KEY"
export OTEL_SERVICE_NAME="my-service"
If you use a coding agent, the maple-onboard skill instruments a repository for you, and maple-audit checks an existing OpenTelemetry setup against Maple’s conventions.
Language guides
- Effect SDK: Maple’s SDK for Effect applications
- Node.js: Express, Fastify, Hono
- Next.js: App Router, Pages Router, middleware
- Python: FastAPI, Django, Flask
- Go
- Rust: through the
tracingcrate - Java: the OpenTelemetry Java agent
- C# / .NET
- Kotlin: Ktor and Spring Boot
- Laravel: Eloquent, queues, HTTP client
The attributes Maple reads for the service map, error grouping and throughput are listed in OpenTelemetry conventions.
Next steps
- Quickstart: your first trace in about five minutes.
- Instrument your application: every language and framework guide.
- OpenTelemetry conventions: the attributes Maple reads.