changelog

What shipped

New features, improvements and fixes, as they land. Anything that needs your attention before you upgrade is marked breaking.

rss markdown roadmap page 4 of 4

July 2026

Billing

Spend limits, and a billing page built around spend

See what you've spent this cycle, where it's heading and what drives it, then set a monthly limit and decide what happens when you reach it.

The spend-first billing page: current spend, what drives it, and a spend limit.

Settings → Billing now leads with spend: what you’ve spent so far this cycle, a projection to the day the bill closes, and the feature driving it. Logs, traces, metrics and session replays each get their own card, and a cumulative chart shows how spend built up. An estimated cost section splits the bill into the base plan and per-feature overage, and past invoices are listed in the app with a link to each one.

Spend limits

Set a monthly ceiling on estimated spend and choose what happens when you reach it:

  • Keep ingesting, with overage accruing at plan rates.
  • Pause ingest at limit: data past the limit is rejected until the cycle resets or you raise the limit.

You can also cap a single feature. Limits are enforced per signal, so a logs cap never stops your traces. Maple checks spend against your limits every hour.

Session replays have a size ceiling too: one session records at most 1 GiB, so a single runaway recording can’t grow without bound.
Integrations

Maple in Slack: alerts and a bot you can ask

Install the Maple app in Slack to route alert rules to any channel and ask the bot about services, errors and traces in a thread.

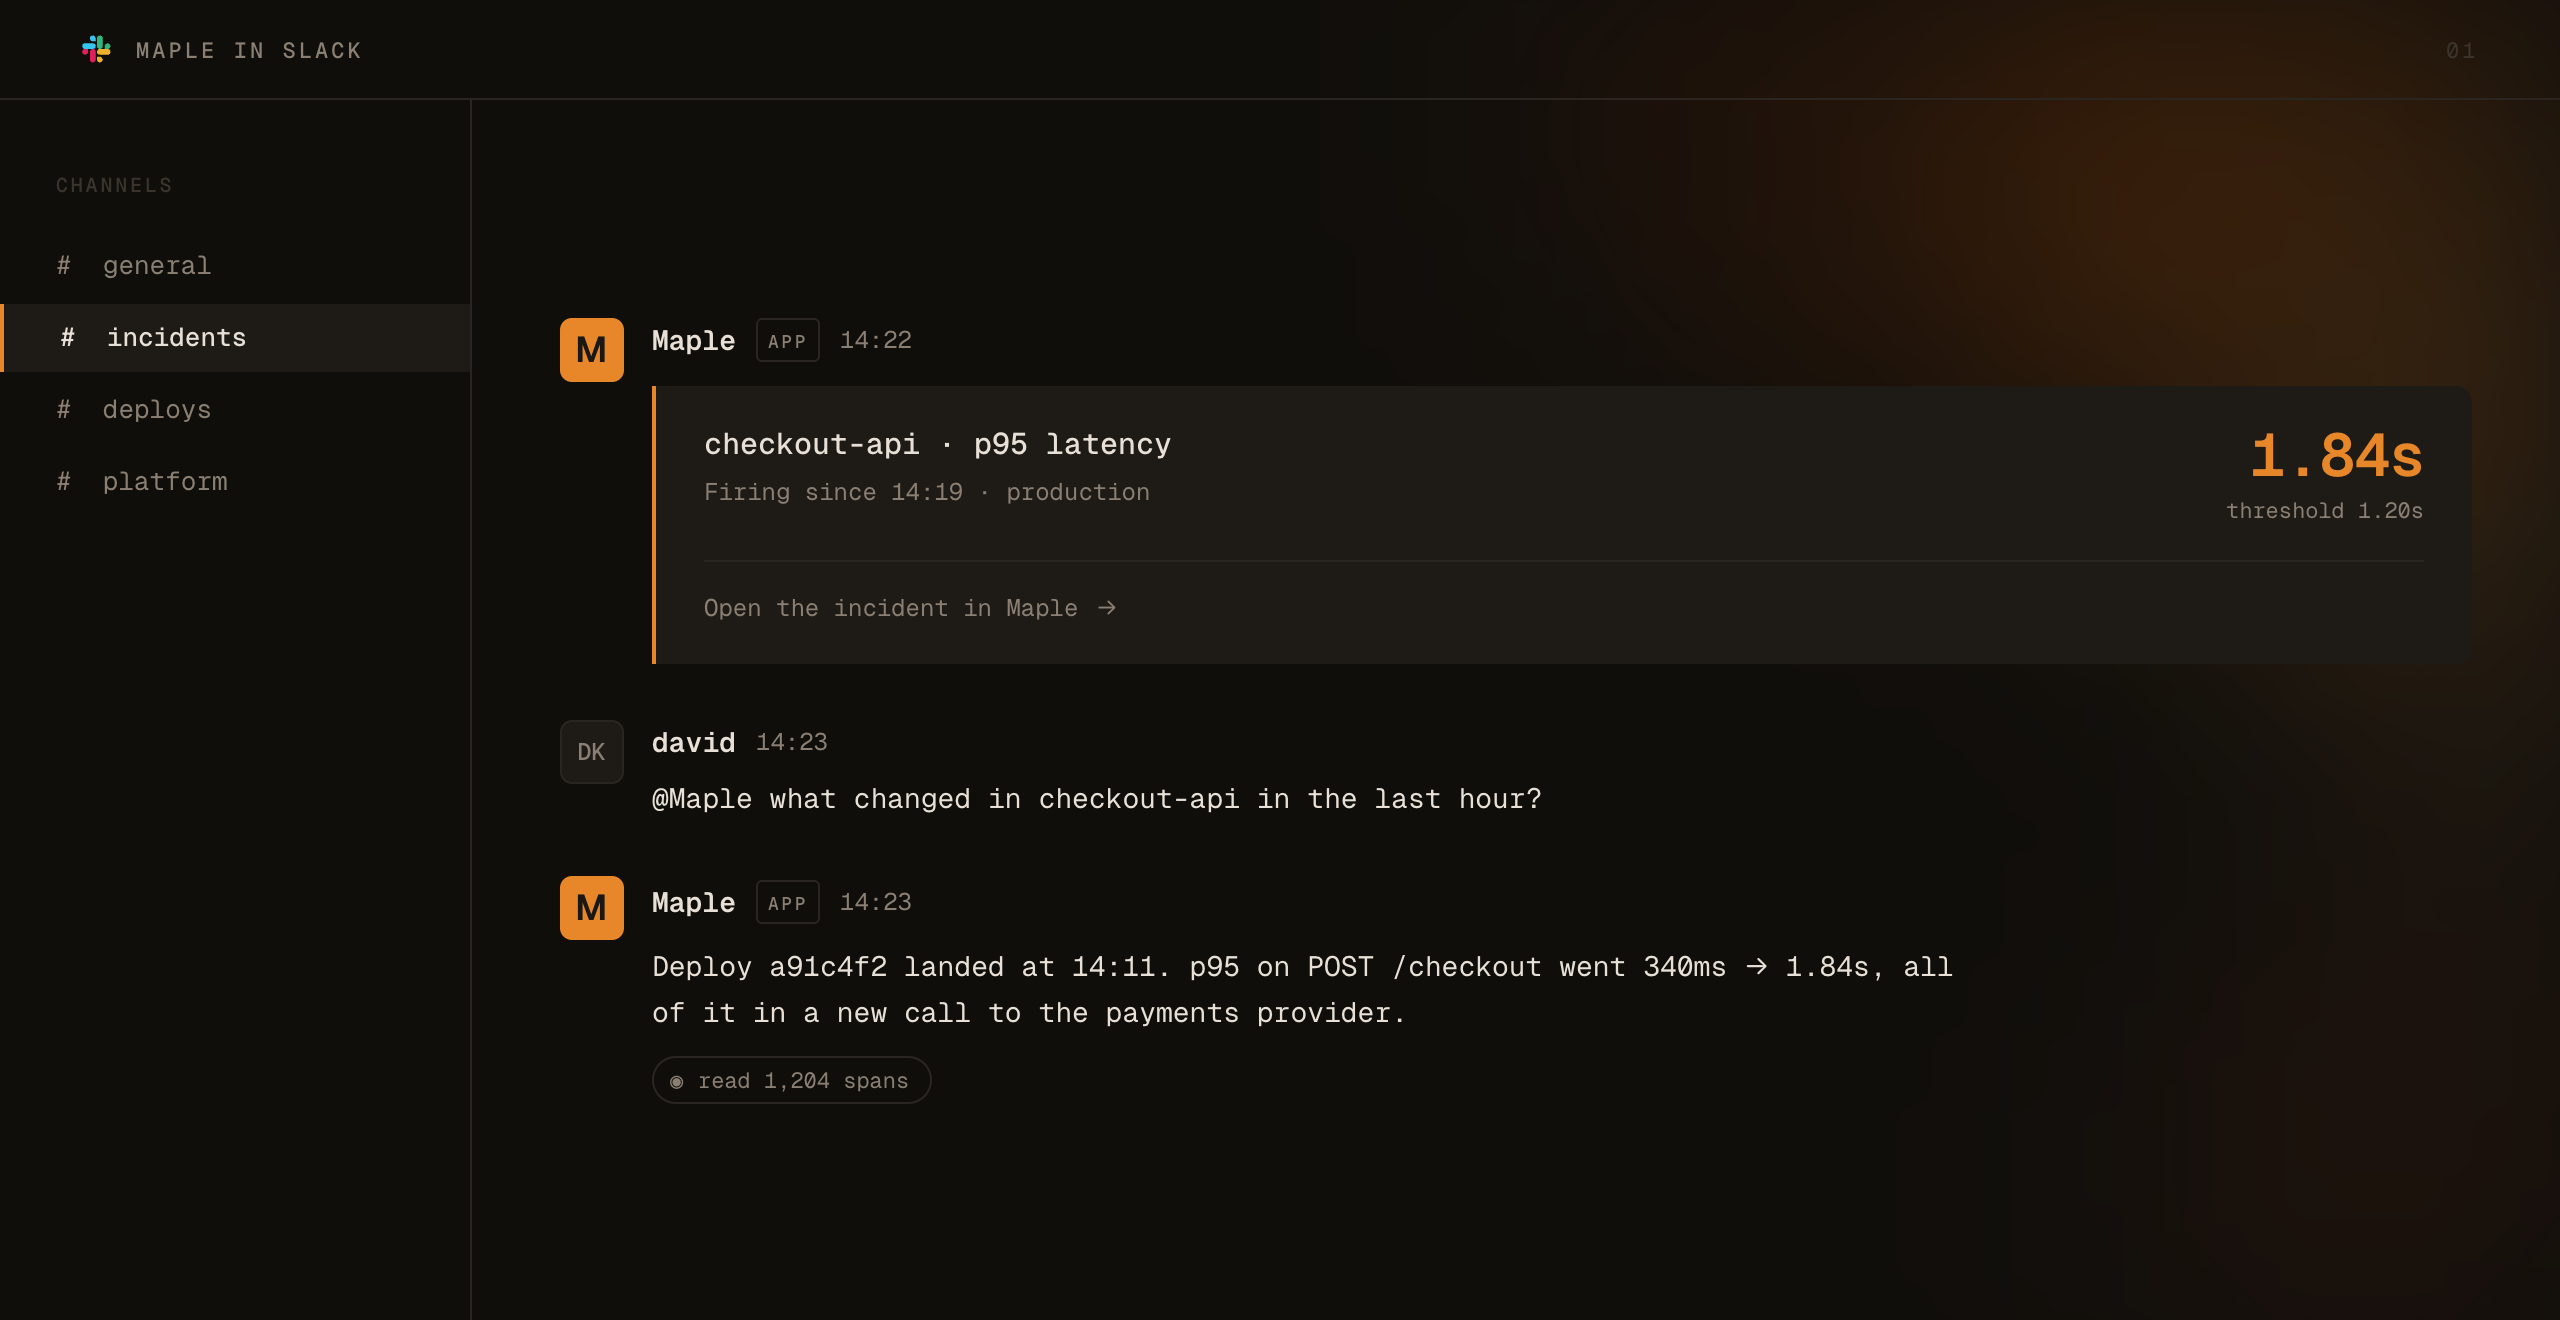
An alert delivered into a Slack channel, followed by someone asking the Maple bot what changed.

An organization admin can now install Maple into your Slack workspace from Integrations → Slack. Linking the workspace gives you two things, and you can use either one on its own.

Alerts in your channels

Your Slack workspace becomes an alert destination. Add a destination, pick the workspace, and choose a channel from the picker. Maple posts through its own bot, so there is no incoming webhook to create. Each notification carries the rule, the value that triggered it, and a link to the alert in Maple.

Ask the bot

Invite the bot to a channel with /invite @Maple, then mention it with a question such as @Maple why is checkout slow?. It answers in a thread using your organization’s traces, logs, metrics and errors, with the same tools as Maple’s MCP server, and shows its progress while it works.

If Maple later needs new Slack permissions, reconnect from the Slack card to update the install in place. You no longer have to uninstall first.

Set it up with the Slack guide.

Platform

Traces, logs, metrics and replays move under Explore

The four signal views share one sidebar section, each service keeps one color everywhere, and the trace timeline and filters got faster.

Traces, Logs, Metrics and Replays now sit together under one Explore section in the sidebar, the same way Infrastructure groups its pages. URLs such as /traces and /logs are unchanged, so your bookmarks and shared links still work.

Also in Explore:

  • One color per service. A service’s color comes from its name, so it matches across charts, traces and the service map, and it no longer shifts when you change the time range.
  • Trace timeline. Zoom and pan stay inside the trace, hover is much faster, and you can zoom with W/S, pan with A/D, and press F to fit.
  • Duration filters. Traces offers one-click > p50, > p95 and > 1s presets from live stats. Replays adds a session-length histogram you can drag to pick a range.
  • Latency colors. p50, p95 and p99 values are colored by how slow they are.
  • Traces works at every screen size, the advanced filter editor has syntax highlighting, and Replays open in a player-first layout.
  • Service map. One node per database, Hyperdrive collapsed into a single node, an environment switcher, Cloudflare edge analytics on instrumented Workers, and no layout shift while loading.
  • Metrics opens as a browsable grid with a shareable page per metric.

Read more in the traces guide.

API

The v2 API, an Alchemy provider and browser CLI login

A documented, stable REST API for your organization, dashboards and alerts as infrastructure-as-code, and browser sign-in for the CLI and MCP.

The Maple v2 API: documented and stable, with an Alchemy provider for declaring Maple resources in code.

The Maple v2 API is the documented, stable HTTP interface to your organization, and the Maple dashboard runs on the same endpoints. It uses one set of conventions throughout: prefixed object IDs (dash_…, key_…), cursor pagination, a single error envelope, and snake_case fields. It covers dashboards, alert rules, destinations and incidents, error issues, scrape targets, ingest and API keys, and read access to traces, logs, metrics and services.

When you create an API key under Settings → API Keys you can now scope it (for example dashboards:read or alerts:write) and set an expiry. Each key gets 600 requests per 60 seconds.

Also shipping:

  • @maple-dev/alchemy: declare dashboards, alert rules, alert destinations and API keys in your alchemy.run.ts and deploy them with the infrastructure they monitor.
  • maple auth login: sign the CLI in through your browser. Credentials go to the macOS Keychain or Linux Secret Service.
  • MCP over OAuth: clients that support MCP authorization connect with only the endpoint URL and a browser sign-in. Standard API keys also work against MCP, and members can now create MCP keys, not only admins.

Get started with the API reference, or browse every operation at api.maple.dev/v2/docs.

Integrations

PlanetScale databases in Maple

Connect your PlanetScale organization once and Maple scrapes every branch, keeps a database inventory, and puts each database on the service map.

The PlanetScale integration in Maple, with branch metrics collected automatically after connecting.

PlanetScale is now a first-class integration. Open Integrations → PlanetScale, authorize your organization, and add a service token with the read_metrics_endpoints permission. Maple discovers every database branch and scrapes its metrics, and picks up new branches on its own. You no longer configure a Prometheus scrape target by hand.

What you get once connected:

  • Infrastructure → PlanetScale: a fleet view of your databases and branches, with a health drill-down for each database.
  • Service map: database nodes your services query are matched to PlanetScale and show live connections, CPU, memory and replica lag. With Cloudflare connected too, a Hyperdrive node links to the PlanetScale database behind it.
  • Query insights: the top queries for each database, pulled from PlanetScale.
  • Webhooks: register Maple’s endpoint in PlanetScale and OOM, storage and anomaly events open issues in Maple.
  • A PlanetScale Databases dashboard template.

Get started with the PlanetScale guide.

SDK

Session replay built into the Effect SDK

The Effect SDK records session replays on its own, so browser apps no longer need the separate @maple-dev/browser package.

If you instrument a browser app with @maple-dev/effect-sdk, it now records session replays itself. You no longer need to add @maple-dev/browser alongside it to see what a user did before an error or a slow request.

Replay is on by default in the browser presets (Maple.layer and MapleFlush.make). Configure it with the replay option: enabled, sampleRate, maskAllInputs (on by default) and maskAllText. The recorder loads in a separate chunk only when a session is sampled, so apps that turn replay off never download it. Sessions that aren’t recorded still show up in Maple with their linked traces.

Upgrade to @maple-dev/effect-sdk 0.6.0. If you use @maple-dev/browser directly, upgrade it to 0.2.0. If both are on a page, the browser package owns the session and the Effect SDK stands down.

Get started with session replay in the Effect SDK.

See your first trace today.

Add the SDK, point your OTLP exporter at Maple, and traces arrive.

maple.dev: observability on OpenTelemetry