# Uptime monitoring
Monitor availability in Maple: alert on traffic stopping and failing requests from your traces, and add HTTP checks from the OpenTelemetry Collector for endpoints and TLS certificates.
Maple monitors availability from two sources. Alert rules on your traces fire when a service stops receiving requests or starts failing them. HTTP checks from the OpenTelemetry Collector cover what real traffic cannot: endpoints with little traffic, and failures that happen before a request reaches your code, such as a DNS change or an expired certificate.
Maple does not run hosted probes. The checks run in a Collector you operate.
> **Recommended reading first.** [Uptime monitoring with traces and HTTP checks](/guides/uptime-monitoring) is the background for this page: which failures a probe catches, which ones only traces see, and when a probe is worth adding. This page is the setup.
## Prerequisites
- Traces arriving from the services you want to watch.
- At least one [notification destination](/docs/alerting/notification-destinations).
- For HTTP checks: the [OpenTelemetry Collector Contrib](https://github.com/open-telemetry/opentelemetry-collector-releases/releases) distribution (`otelcol-contrib`) on a host outside the system it checks, and a private ingest key (`maple_sk_…`) from **Settings → Ingestion**.
## Alert on real traffic
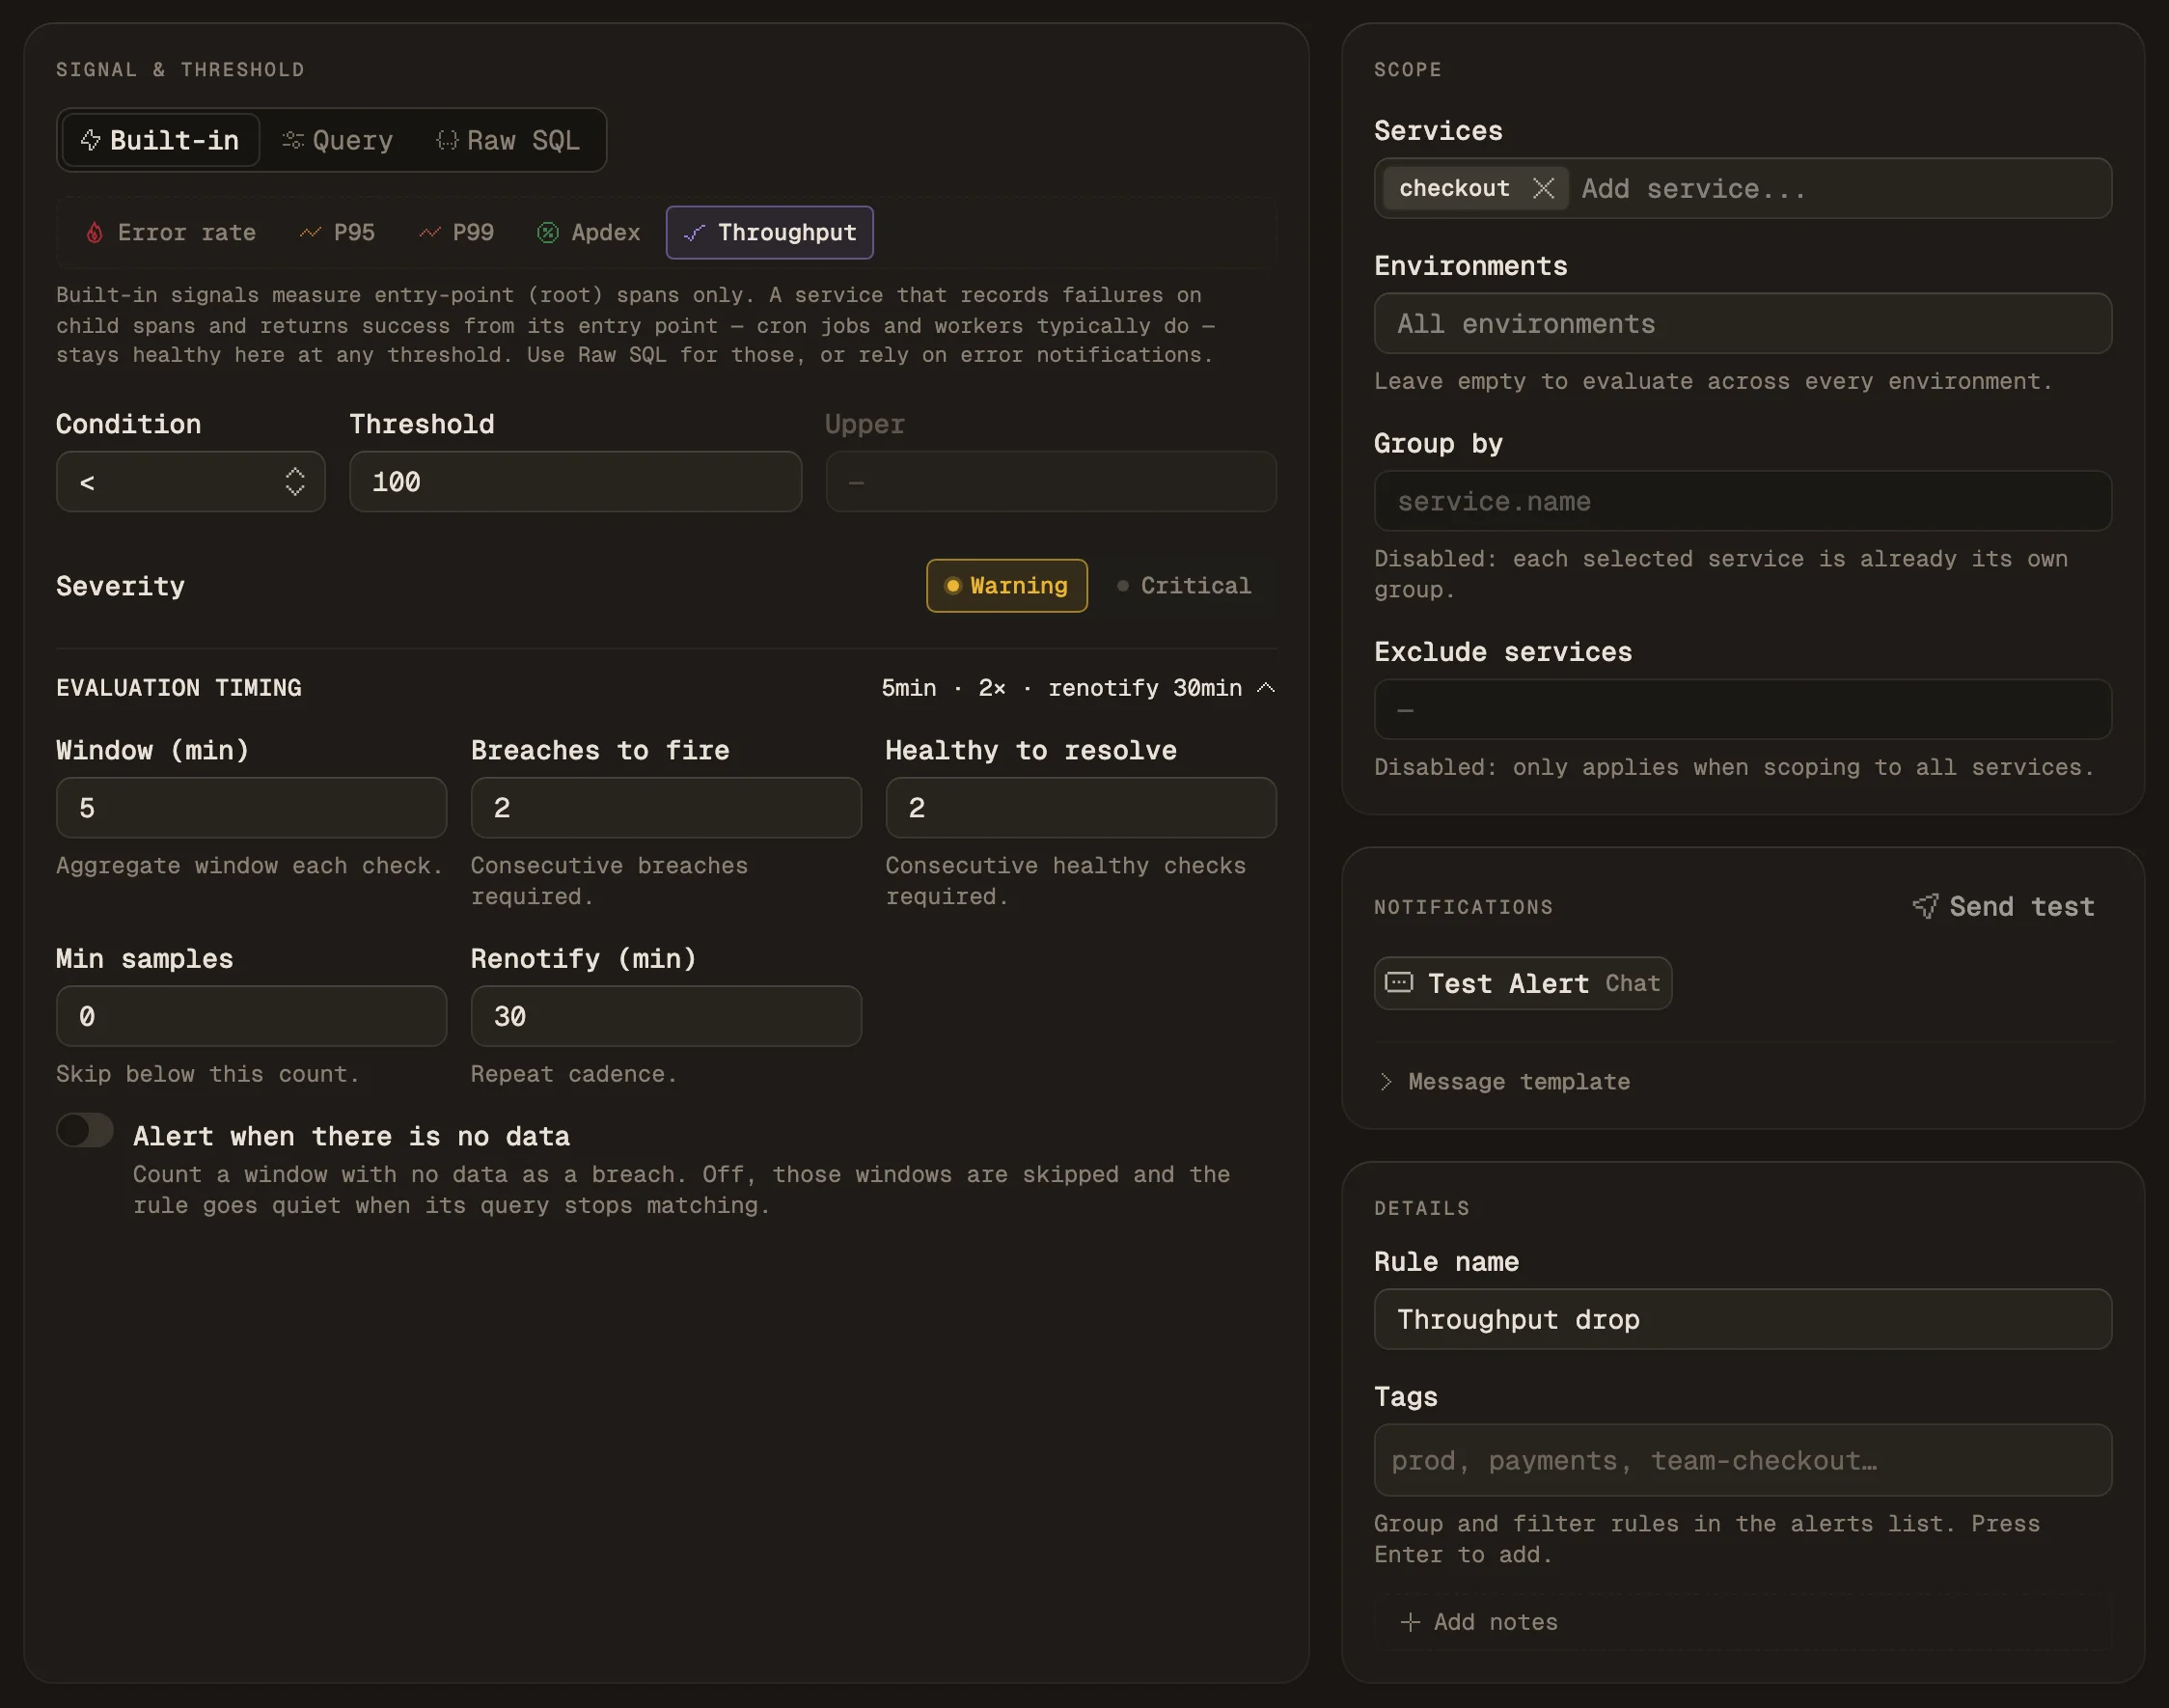
1. Open **Alerts**, click **New rule** and pick the **Throughput drop** template.
2. Under **Scope**, select the service. The template sets **Min samples** to 0, so a window with no requests counts as zero and fires.
3. Set **Threshold** below the service's quietest five minutes on a normal day.
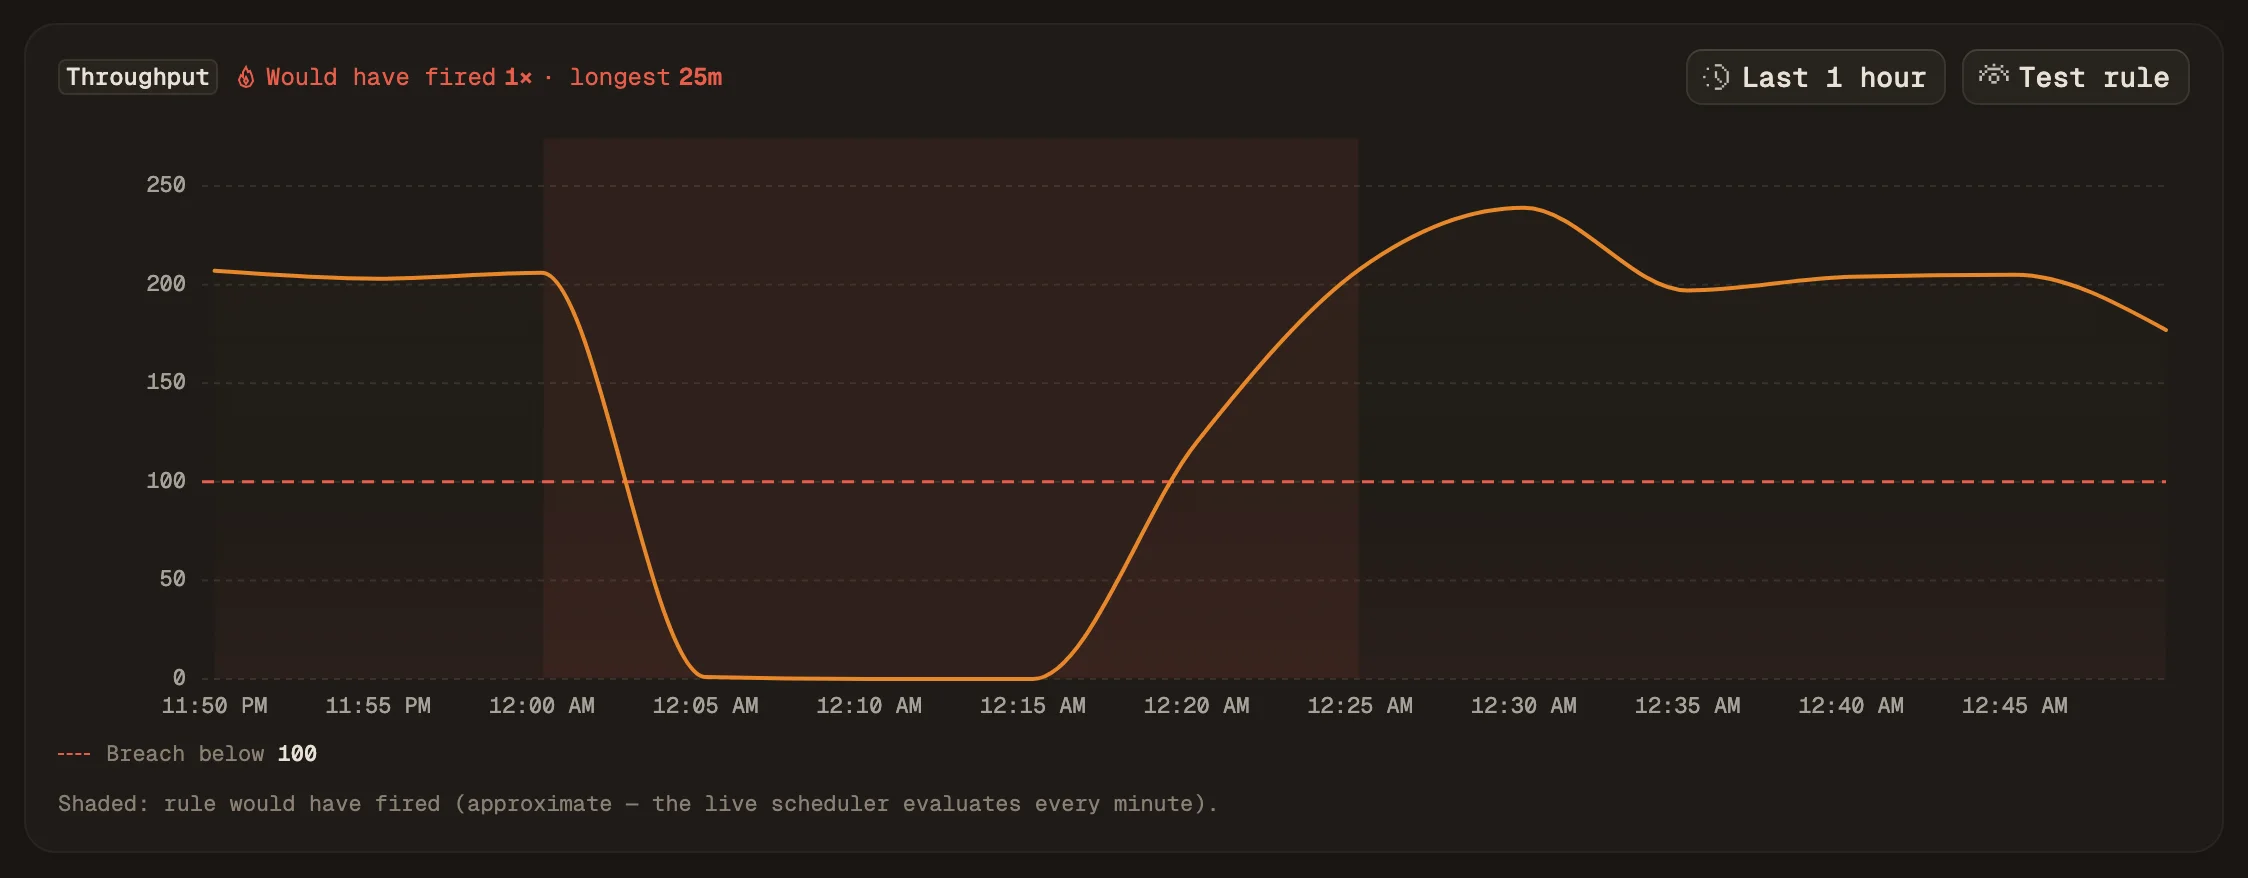
4. Pick a range above the chart to replay the rule. The shaded periods are where it would have held an incident open.
5. Attach a destination and click **Create rule**.
A Throughput drop rule scoped to one service. Evaluation timing is opened to show Min samples at 0.The rule replayed over the last hour. Requests stopped for about 15 minutes.
Add the **High error rate** template for failing requests and **Low Apdex score** for slow ones. [Alert rules](/docs/alerting/alert-rules) describes every field.
A throughput rule needs traffic to drop from. For a service that sits idle for hours, use an HTTP check.
## Add HTTP checks
The Collector's `http_check` receiver requests a list of URLs on an interval and reports each result as metrics. Save this as `config.yaml`:
```yaml
receivers:
http_check:
collection_interval: 60s
metrics:
httpcheck.tls.cert_remaining:
enabled: true
targets:
- method: GET
endpoints:
- https://example.com
- https://api.example.com/health
processors:
resource/uptime:
attributes:
- key: service.name
value: uptime-checks
action: upsert
batch: {}
exporters:
otlphttp/maple:
endpoint: https://ingest.maple.dev
compression: gzip
headers:
x-maple-ingest-key: ${env:MAPLE_INGEST_KEY}
service:
pipelines:
metrics/uptime:
receivers: [http_check]
processors: [resource/uptime, batch]
exporters: [otlphttp/maple]
```
Start the Collector with your key in the environment:
```bash
MAPLE_INGEST_KEY=YOUR_INGEST_KEY otelcol-contrib --config config.yaml
```
Notes on the config:
- **Older Collector releases name the receiver `httpcheck`.** Use that name in both places if your release rejects `http_check`.
- **`resource/uptime` sets `service.name`.** The checks appear in Maple under the service `uptime-checks`.
- **EU organizations** use `https://ingest.eu.maple.dev` as the endpoint.
- **Run the Collector outside the system it checks.** On the same machine as the service, it goes down with it.
## What the receiver reports
| Metric | Value |
| ------------------------------ | ------------------------------------------------------------------------------------------------------------------------------------------------ |
| `httpcheck.status` | One data point per status class (`1xx` to `5xx`): 1 for the class the response matched, 0 for the rest. A failed connection reports 0 for every class. |
| `httpcheck.error` | 1 when the request failed before a response arrived, with the reason in `error.message`. |
| `httpcheck.duration` | Total request time in milliseconds. |
| `httpcheck.tls.cert_remaining` | Seconds until the certificate expires. Off unless enabled, as in the config above. |
Every data point carries the checked address in `http.url`.
## Alert when an endpoint stops answering
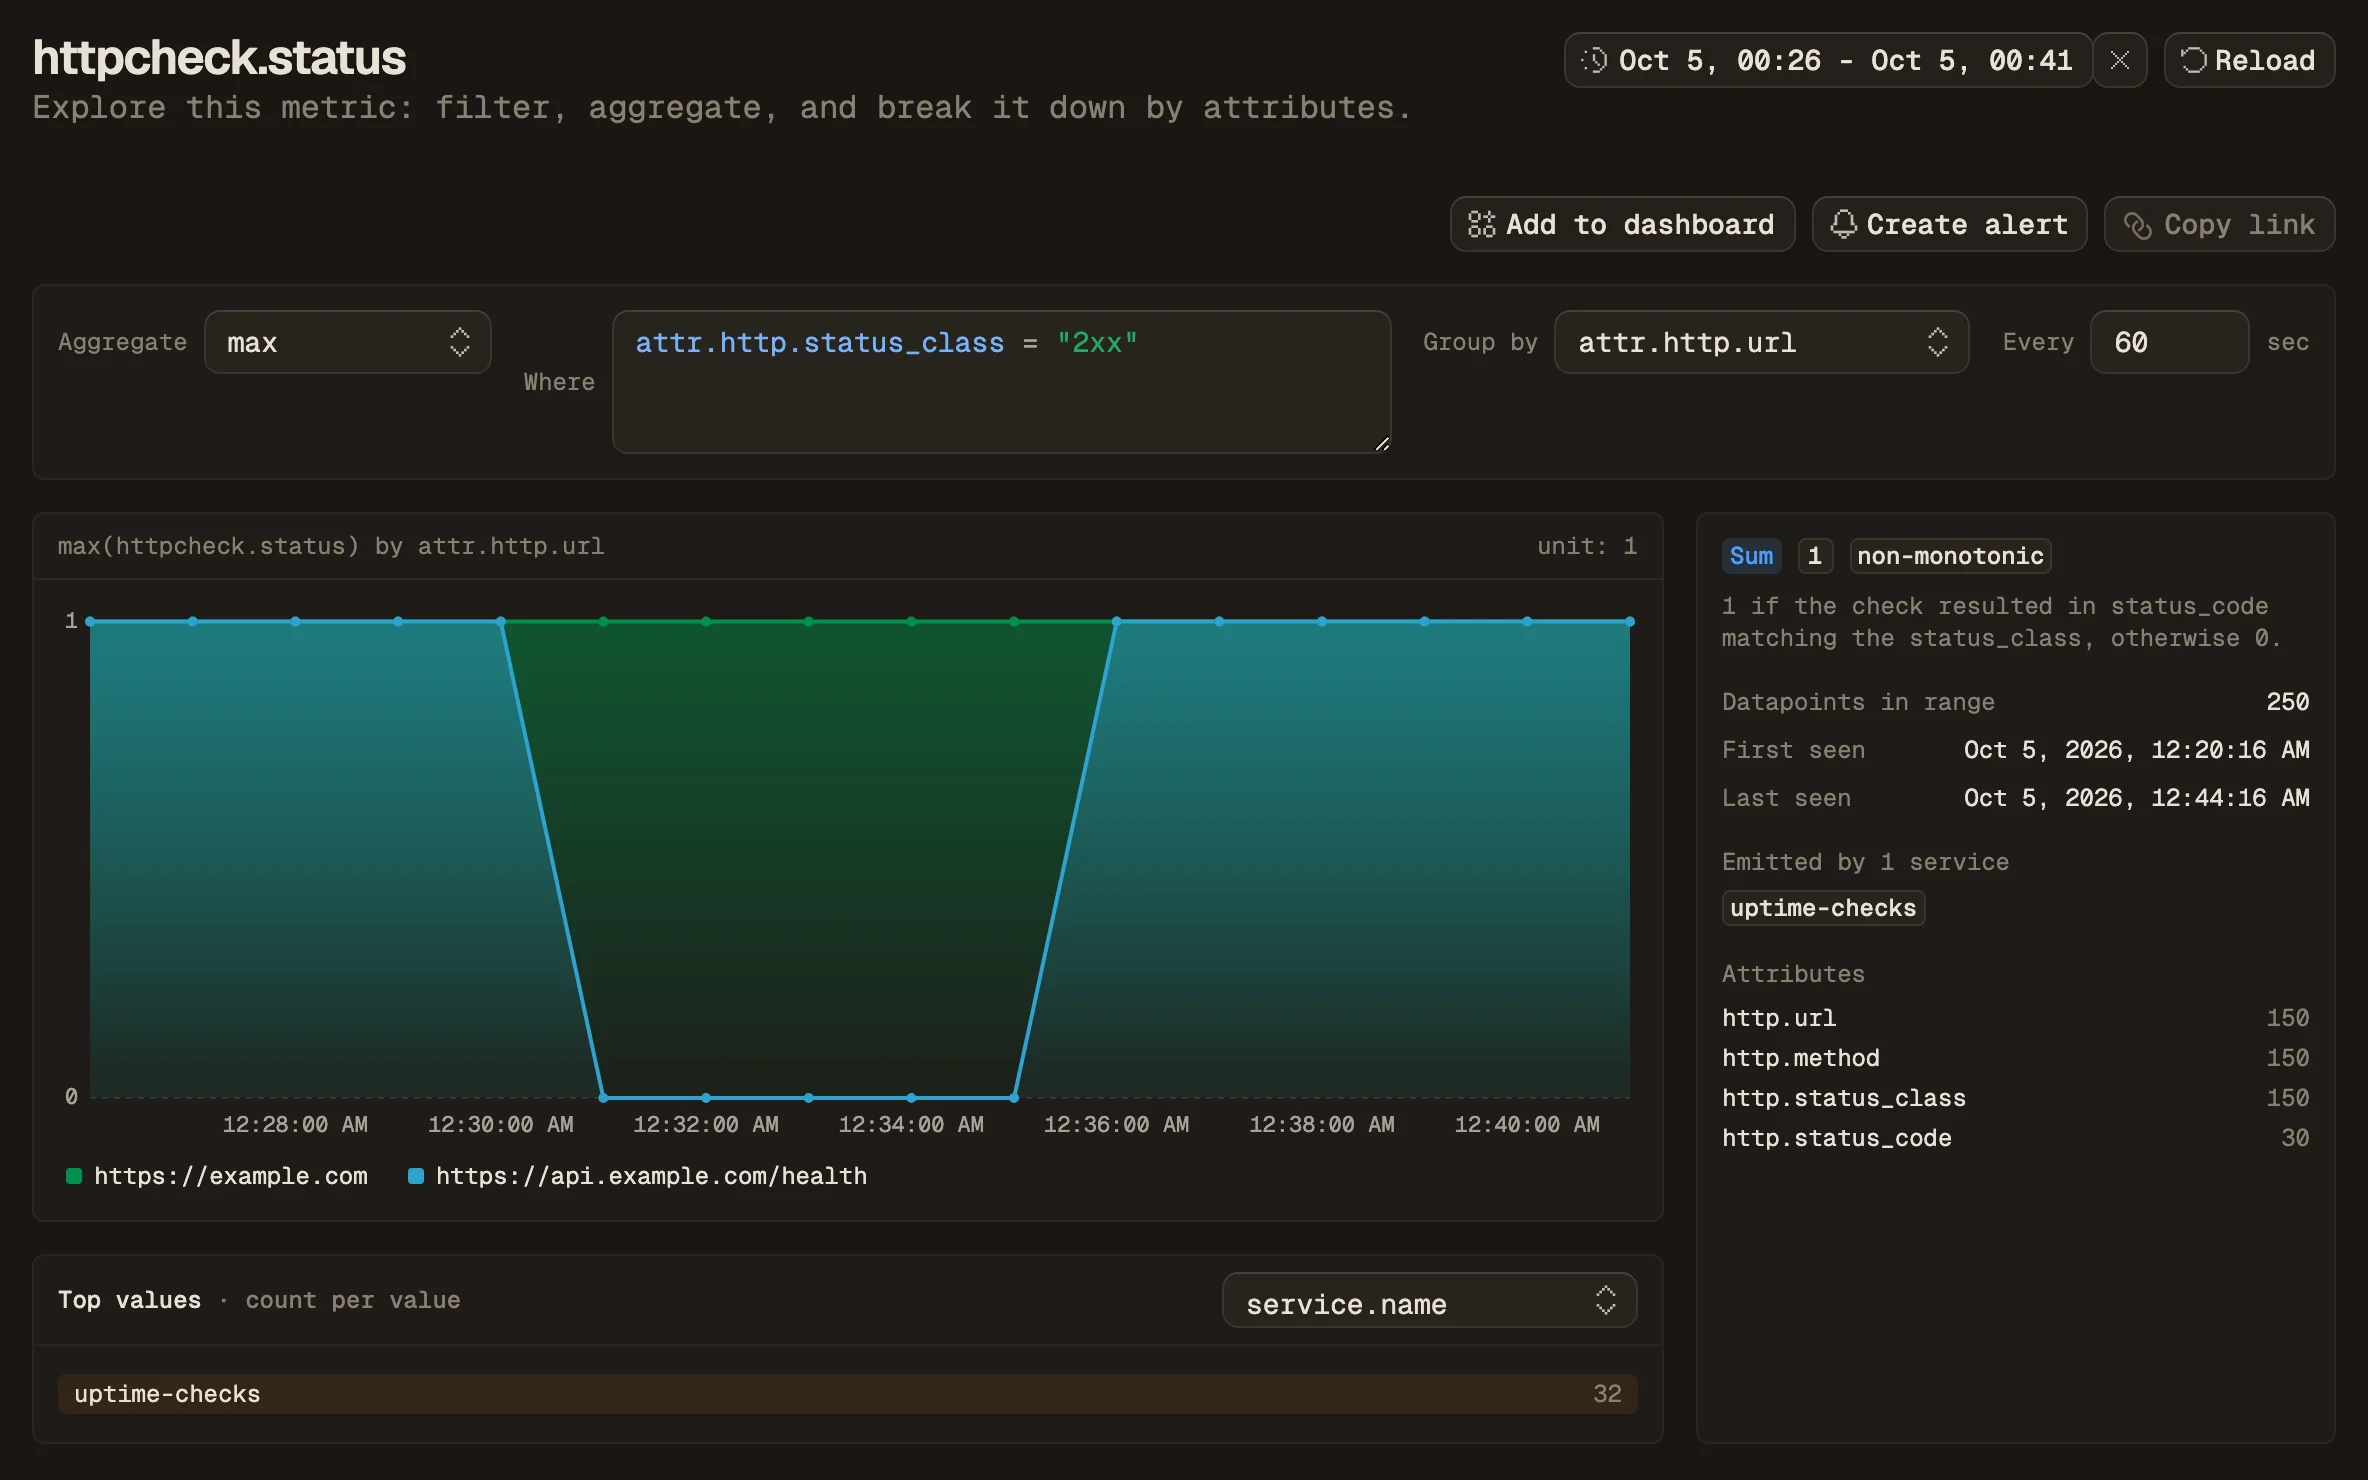
1. Open **Metrics** and open `httpcheck.status`.
2. Set **Aggregate** to `max`, **Where** to `attr.http.status_class = "2xx"`, and **Group by** to `attr.http.url`. Keep the `attr.` prefix on the filter, or it is dropped when the chart becomes a rule.
3. Click **Create alert**.
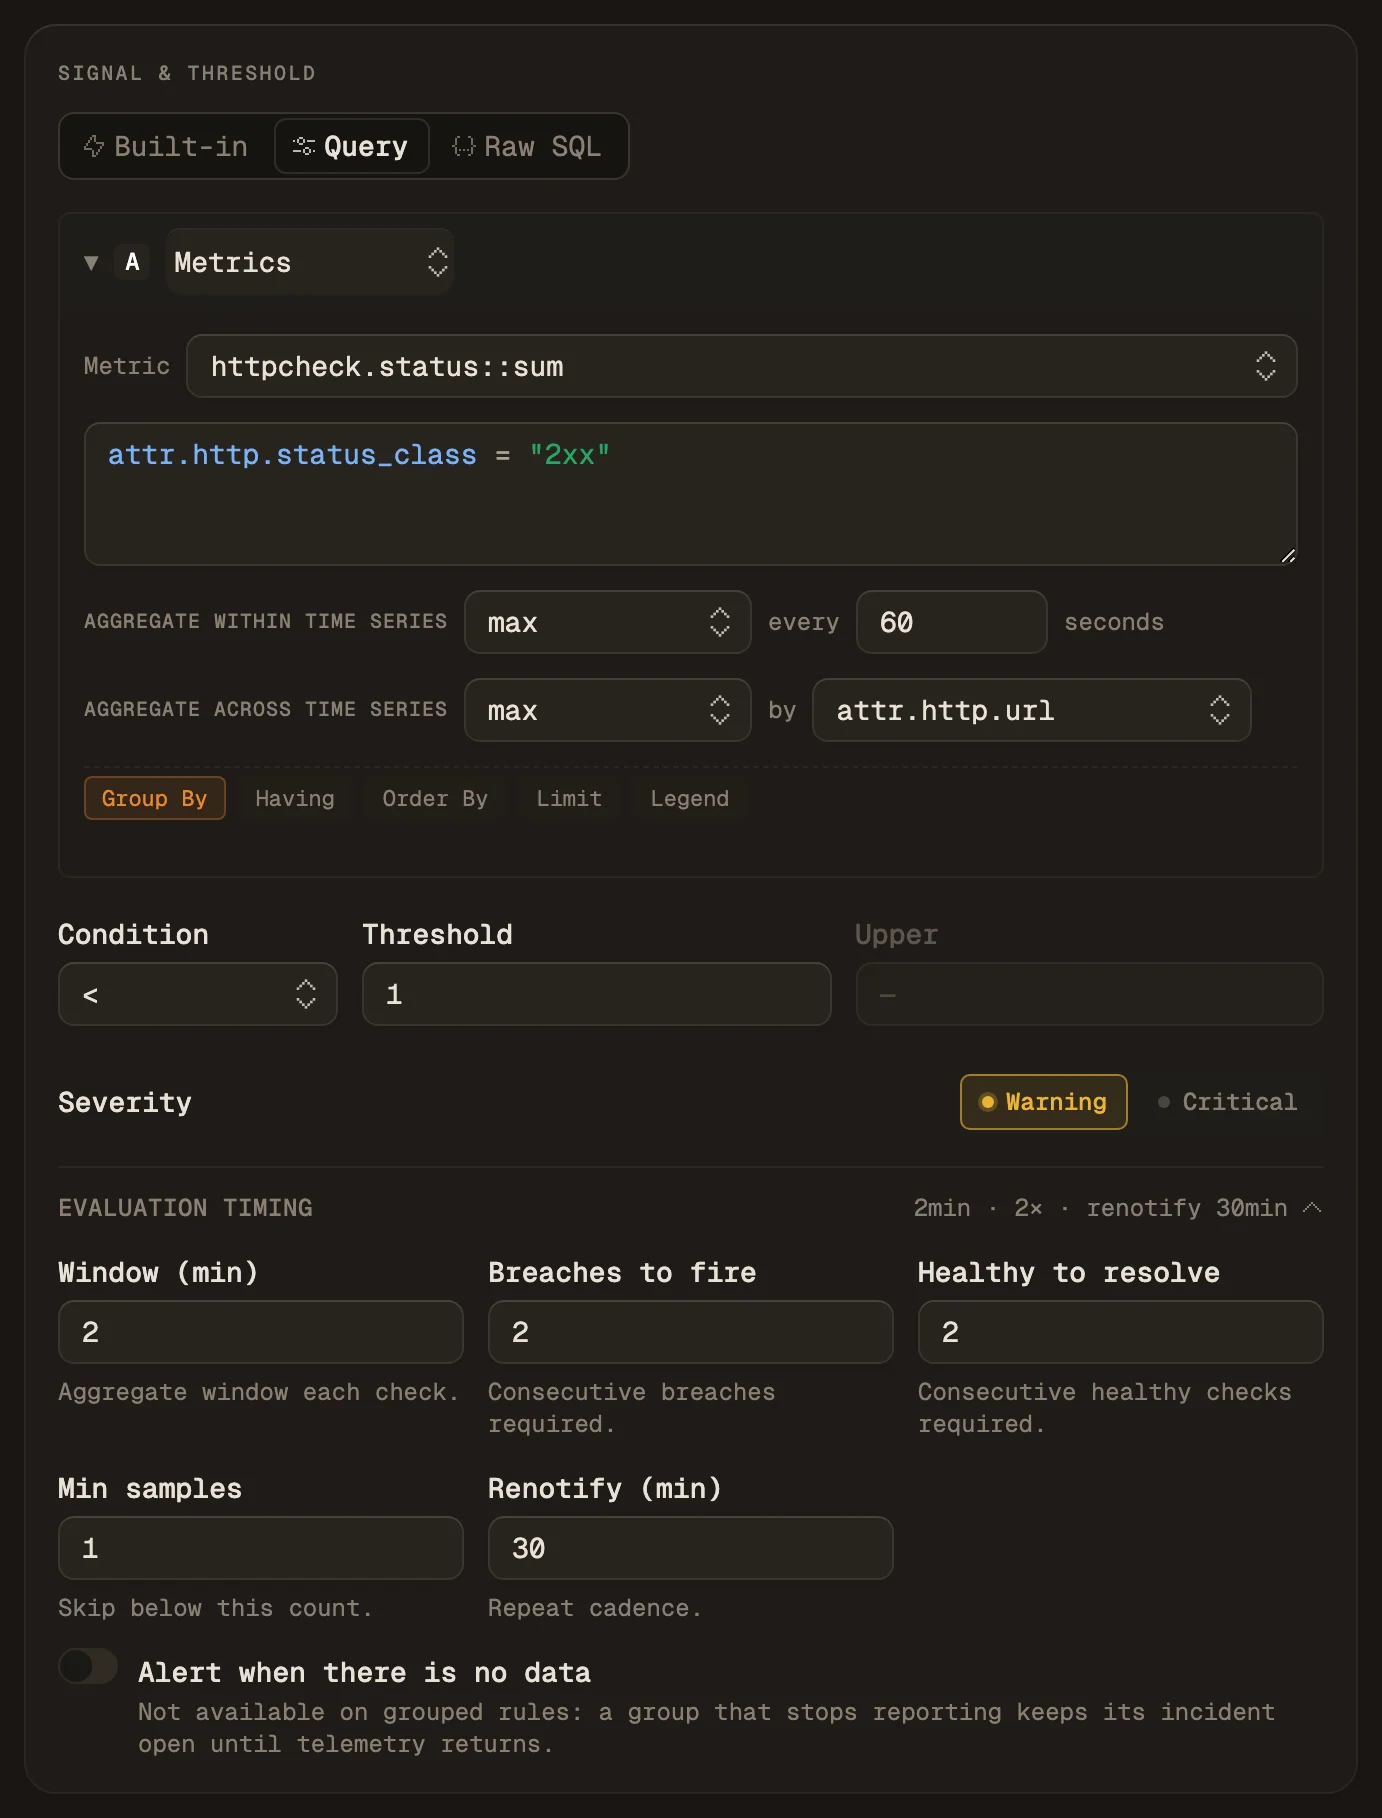
4. Set **Condition** to `<` and **Threshold** to `1`.
5. Open **Evaluation timing**. Set **Window (min)** to 2 and **Min samples** to 1. A two-minute window holds two data points per URL, so the default of 50 would skip every check.
6. Leave **Breaches to fire** at 2.
7. Attach a destination and click **Create rule**.
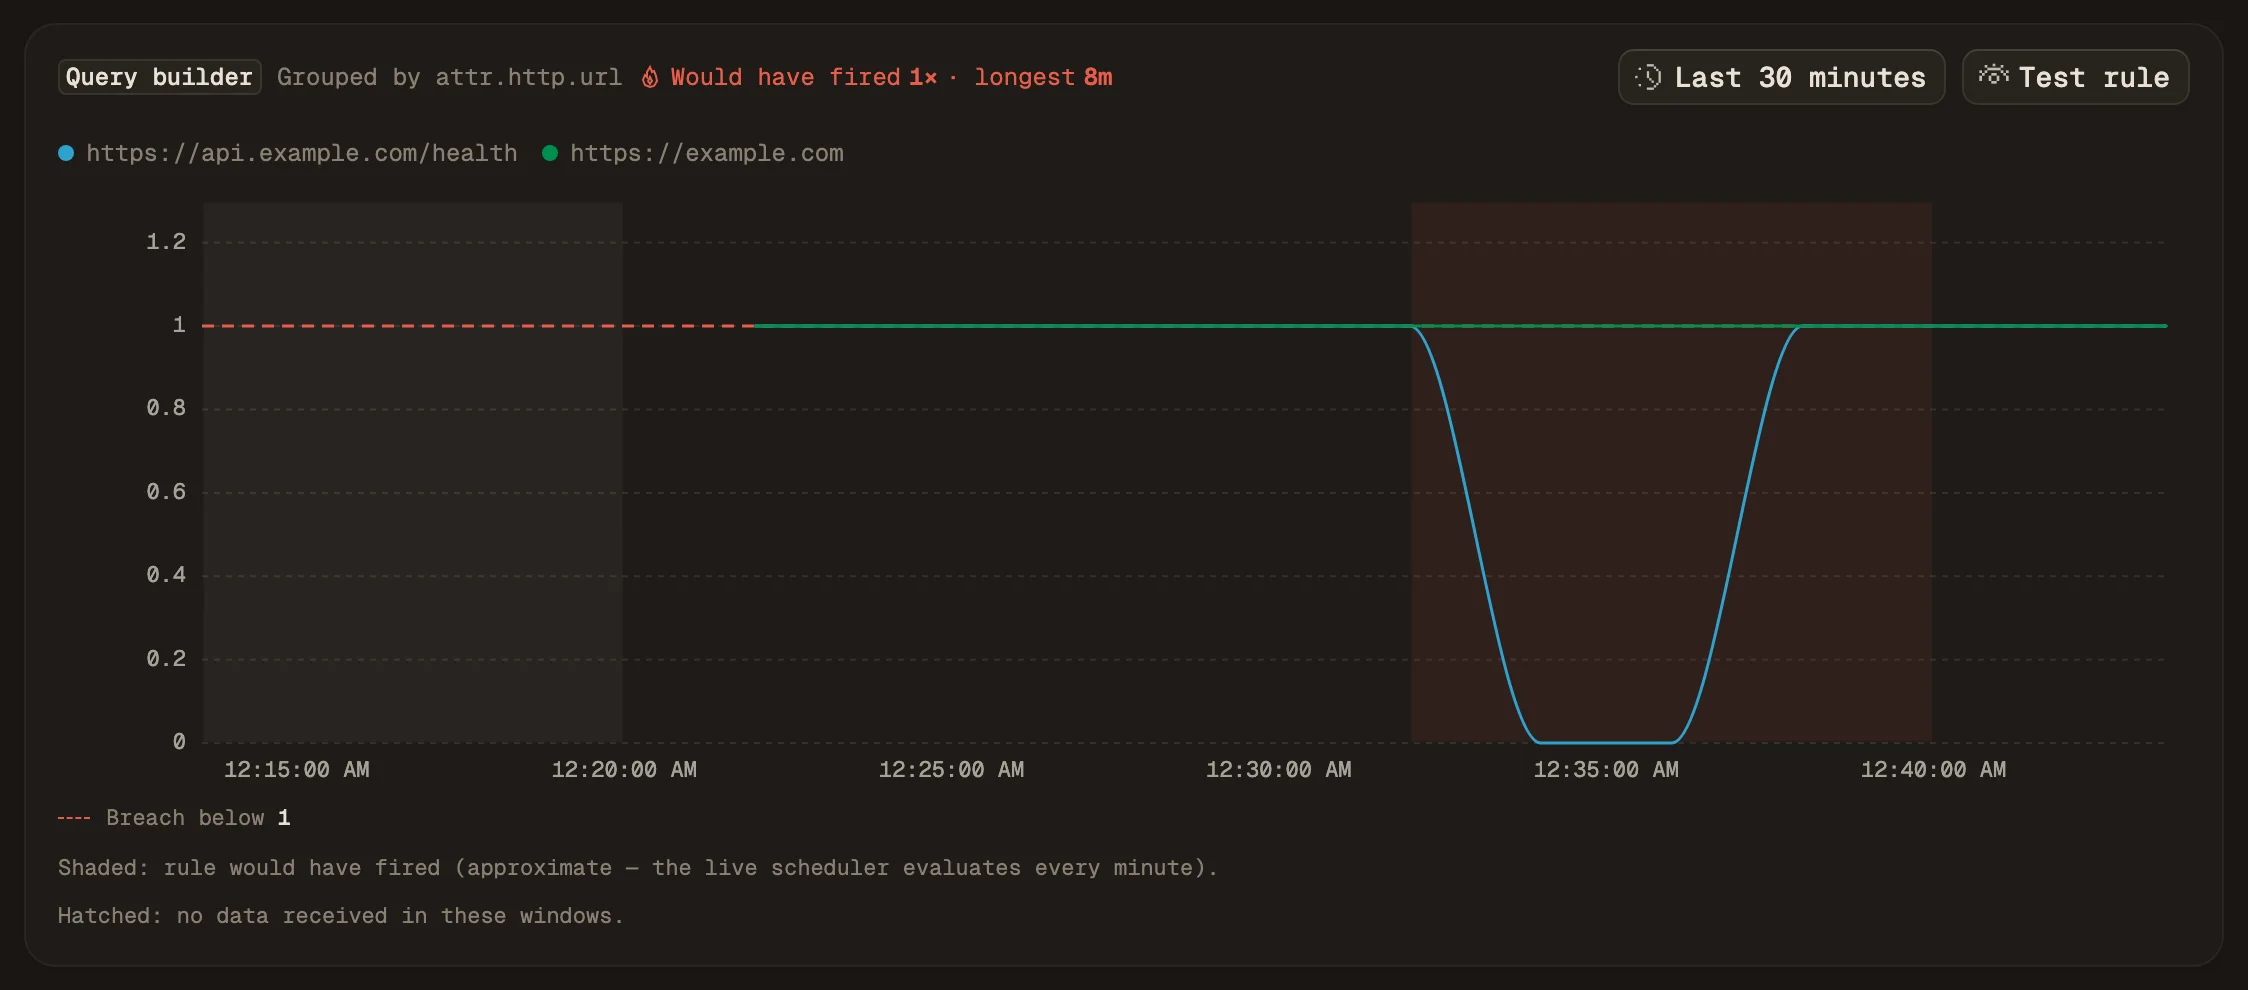
The rule reads: no check of this URL returned a 2xx in the last two minutes. It opens one incident per URL, about three minutes into an outage, and one failed check on its own does not fire it.
Step 2: the check charted per URL. One endpoint returned 503 for five checks while the other stayed up.Steps 4 to 6: the condition, the window and Min samples.The rule replayed over the last 30 minutes. It would have fired once, for the endpoint that returned 503.
## Alert when the checks stop arriving
A grouped rule skips a window with no data, so a stopped Collector would go unnoticed. Create a second rule on `httpcheck.status` with no group-by:
- **Aggregate** `count`, **Condition** `<`, **Threshold** `1`
- **Min samples** 1
- **Alert when there is no data** switched on
## Alert before a certificate expires
Create a rule on `httpcheck.tls.cert_remaining`:
- **Aggregate** `min`, **Group by** `attr.http.url`
- **Condition** `<`, **Threshold** `1209600` (14 days in seconds)
- **Min samples** 1
## Verify
Open **Metrics** and search for `httpcheck`. The metrics appear after the first check, emitted by the service `uptime-checks`. Open `httpcheck.status` and group by `attr.http.url` to see one series per target.
## Limits
- One Collector probes from one place, through one DNS resolver. It cannot show that users in another region are cut off, and a network problem next to the Collector looks the same as an outage.
- There is no status page.
For probes from several regions, a public status page, or an availability report for customers, run a dedicated uptime product next to Maple.
## Troubleshooting
- **No `httpcheck` metrics appear.** Check the Collector's output for exporter errors. A `401` means the ingest key is wrong or was rotated.
- **The alert form warns "Unsupported metrics filter ignored".** The filter key is missing the `attr.` prefix. Use `attr.http.status_class`.
- **Every check of the rule is skipped.** The window holds fewer data points than **Min samples**. Set it to 1.
- **The rule fires on a single failed check.** **Aggregate** is `min`. With `max`, every check in the window has to fail.
## Next steps
- [Alert rules](/docs/alerting/alert-rules): every signal, field and template.
- [Incidents](/docs/alerting/incidents): what happens after a rule fires.
- [Metrics](/docs/explore/metrics): chart `httpcheck.duration` and the other check metrics.
- [Uptime monitoring with traces and HTTP checks](/guides/uptime-monitoring): the reasoning behind this setup.