# Apdex alerts

How to set up an Apdex alert in Maple: pick the target latency T, choose the score worth paging for, scope and tune the rule, and create the same rule over the API.

A p95 latency alert tells you that 5% of requests were slower than some number. It does not tell you whether that was 5 requests or 50,000, and it says nothing about the requests that failed outright.

**Apdex answers a different question:** of everything that hit this service in the last five minutes, what share of it was <span class="hl-ok">fast enough to keep a user happy</span>?

<div class="my-7 grid gap-3 sm:grid-cols-2 not-prose">
  <div class="rounded-lg border border-border p-4" style="background: color-mix(in oklab, var(--bg-elevated) 45%, transparent)">
    <div class="text-[10px] uppercase tracking-wider" style="color: var(--muted-foreground)">A p95 alert says</div>
    <div class="mt-2 text-sm text-fg">“The slow 5% crossed 1 second.”</div>
    <div class="mt-2 text-xs text-fg-muted">Shape of the tail. Silent when requests fail fast.</div>
  </div>
  <div class="rounded-lg border p-4" style="border-color: color-mix(in oklab, var(--primary) 45%, var(--border)); background: color-mix(in oklab, var(--primary) 8%, transparent)">
    <div class="text-[10px] uppercase tracking-wider" style="color: var(--primary)">An Apdex alert says</div>
    <div class="mt-2 text-sm text-fg">“One request in five was slow or broken.”</div>
    <div class="mt-2 text-xs text-fg-muted">Size of the tail, counting failures as unhappy users.</div>
  </div>
</div>

## The score in one line

Apdex compresses a latency distribution into a single number between <span class="hl-bad">0</span> and <span class="hl-ok">1</span>: the share of requests that were fast enough to keep a user happy. You set one target time, <span class="hl-t">T</span>. Requests under <span class="hl-t">T</span> are <span class="hl-ok">satisfied</span> and score a point, requests under <span class="hl-t">4T</span> are <span class="hl-warn">tolerating</span> and score half, and everything slower is <span class="hl-bad">frustrated</span> and scores nothing. A request that failed is frustrated too, at any speed.

<div class="my-6 rounded-lg border border-border p-5 text-center not-prose" style="background: color-mix(in oklab, var(--bg-elevated) 55%, transparent)">
  <div class="font-mono text-[15px] text-fg">Apdex = (satisfied + 0.5 × tolerating) / total</div>
  <div class="mt-2 text-xs text-fg-muted">Always between 0 and 1. Both boundaries come from the single value you set for T.</div>
</div>

Counting failures as frustrated is what makes this worth alerting on. A dependency that starts failing 15% of requests in 40ms makes your p95 _faster_, so a latency alert stays quiet while Apdex falls from 0.97 to about 0.83.

[**What is Apdex?**](/guides/what-is-apdex) walks through the formula, a worked example, and where Apdex and latency percentiles disagree. The rest of this page is the Maple-specific part: picking T for a rule, and building it.

## Choosing T for the rule

<span class="hl-t">T</span> is the whole rule. It sets the <span class="hl-ok">satisfied</span> boundary directly and the <span class="hl-bad">frustrated</span> boundary implicitly, since the <span class="hl-warn">tolerating</span> band always ends at <span class="hl-t">4T</span>. Move T from 500ms to 1s and you have also moved the frustrated line from 2s to 4s.

Pick T as the latency at which your users stop perceiving the response as immediate, per class of traffic:

<div class="my-6 overflow-hidden rounded-lg border border-border not-prose">
  <div class="grid gap-px sm:grid-cols-2" style="background: var(--border)">
    <div class="p-4" style="background: var(--background)">
      <div class="font-mono text-sm" style="color: var(--primary)">200ms – 300ms</div>
      <div class="mt-1 text-sm text-fg">Internal or service-to-service APIs</div>
      <div class="mt-1 text-xs text-fg-muted">They sit inside someone else's request, so their budget is small.</div>
    </div>
    <div class="p-4" style="background: var(--background)">
      <div class="font-mono text-sm" style="color: var(--primary)">500ms</div>
      <div class="mt-1 text-sm text-fg">User-facing API endpoints</div>
      <div class="mt-1 text-xs text-fg-muted">Maple's default, and a fair starting point for a JSON API behind a UI.</div>
    </div>
    <div class="p-4" style="background: var(--background)">
      <div class="font-mono text-sm" style="color: var(--primary)">1s – 2s</div>
      <div class="mt-1 text-sm text-fg">Full page loads and heavy reports</div>
      <div class="mt-1 text-xs text-fg-muted">Users accept more from something that visibly does more work.</div>
    </div>
    <div class="p-4" style="background: var(--background)">
      <div class="font-mono text-sm text-fg-muted">n/a</div>
      <div class="mt-1 text-sm text-fg">Background and batch endpoints</div>
      <div class="mt-1 text-xs text-fg-muted">Nobody is waiting. Alert on throughput or failure rate instead.</div>
    </div>
  </div>
</div>

> **Two ways to pick a T that tells you nothing.** Setting T to your current p95 guarantees a score near 0.95 forever. Setting it so tight that a healthy week already reads 0.6 buries every threshold you might pick inside your normal noise.

To choose, open the service's Apdex chart in Maple, set T, and check that a healthy week reads somewhere in the 0.9 to 1.0 band. That leaves the 0.8 line meaningful.

## Choosing the threshold you defend

<div class="my-6 space-y-2 not-prose">
  <div class="flex items-center gap-3 rounded-lg border border-border px-4 py-3" style="background: color-mix(in oklab, var(--bg-elevated) 55%, transparent)">
    <span class="w-[92px] shrink-0 font-mono text-sm" style="color: var(--success)">0.94 – 1.00</span>
    <span class="text-sm text-fg-muted">Healthy, with a normal slow tail.</span>
  </div>
  <div class="flex items-center gap-3 rounded-lg border border-border px-4 py-3" style="background: color-mix(in oklab, var(--bg-elevated) 55%, transparent)">
    <span class="w-[92px] shrink-0 font-mono text-sm" style="color: var(--warning)">0.85 – 0.94</span>
    <span class="text-sm text-fg-muted">Degraded, and users can feel it.</span>
  </div>
  <div class="flex items-center gap-3 rounded-lg border border-border px-4 py-3" style="background: color-mix(in oklab, var(--bg-elevated) 55%, transparent)">
    <span class="w-[92px] shrink-0 font-mono text-sm" style="color: var(--destructive)">below 0.80</span>
    <span class="text-sm text-fg-muted">The common alerting line. Roughly a fifth of traffic is frustrated or worse.</span>
  </div>
  <div class="flex items-center gap-3 rounded-lg border border-border px-4 py-3" style="background: color-mix(in oklab, var(--bg-elevated) 55%, transparent)">
    <span class="w-[92px] shrink-0 font-mono text-sm" style="color: var(--destructive)">below 0.50</span>
    <span class="text-sm text-fg-muted">Most requests are failing or timing out.</span>
  </div>
</div>

0.8 is a common convention. Set the threshold from where your service sits when it is healthy, and how far it has to fall before you would want to be woken up.

## Setting up an Apdex alert in Maple

Maple computes Apdex over the entry-point spans of a service: server spans, consumer spans and trace roots. The service's Apdex chart draws the same set of requests, so a rule you build here matches the chart.

### 1. Start from the Low Apdex score template

Open **Alerts → New rule**. Starting from a service page instead (**Services → your service → Create Alert**) pre-fills the scope.

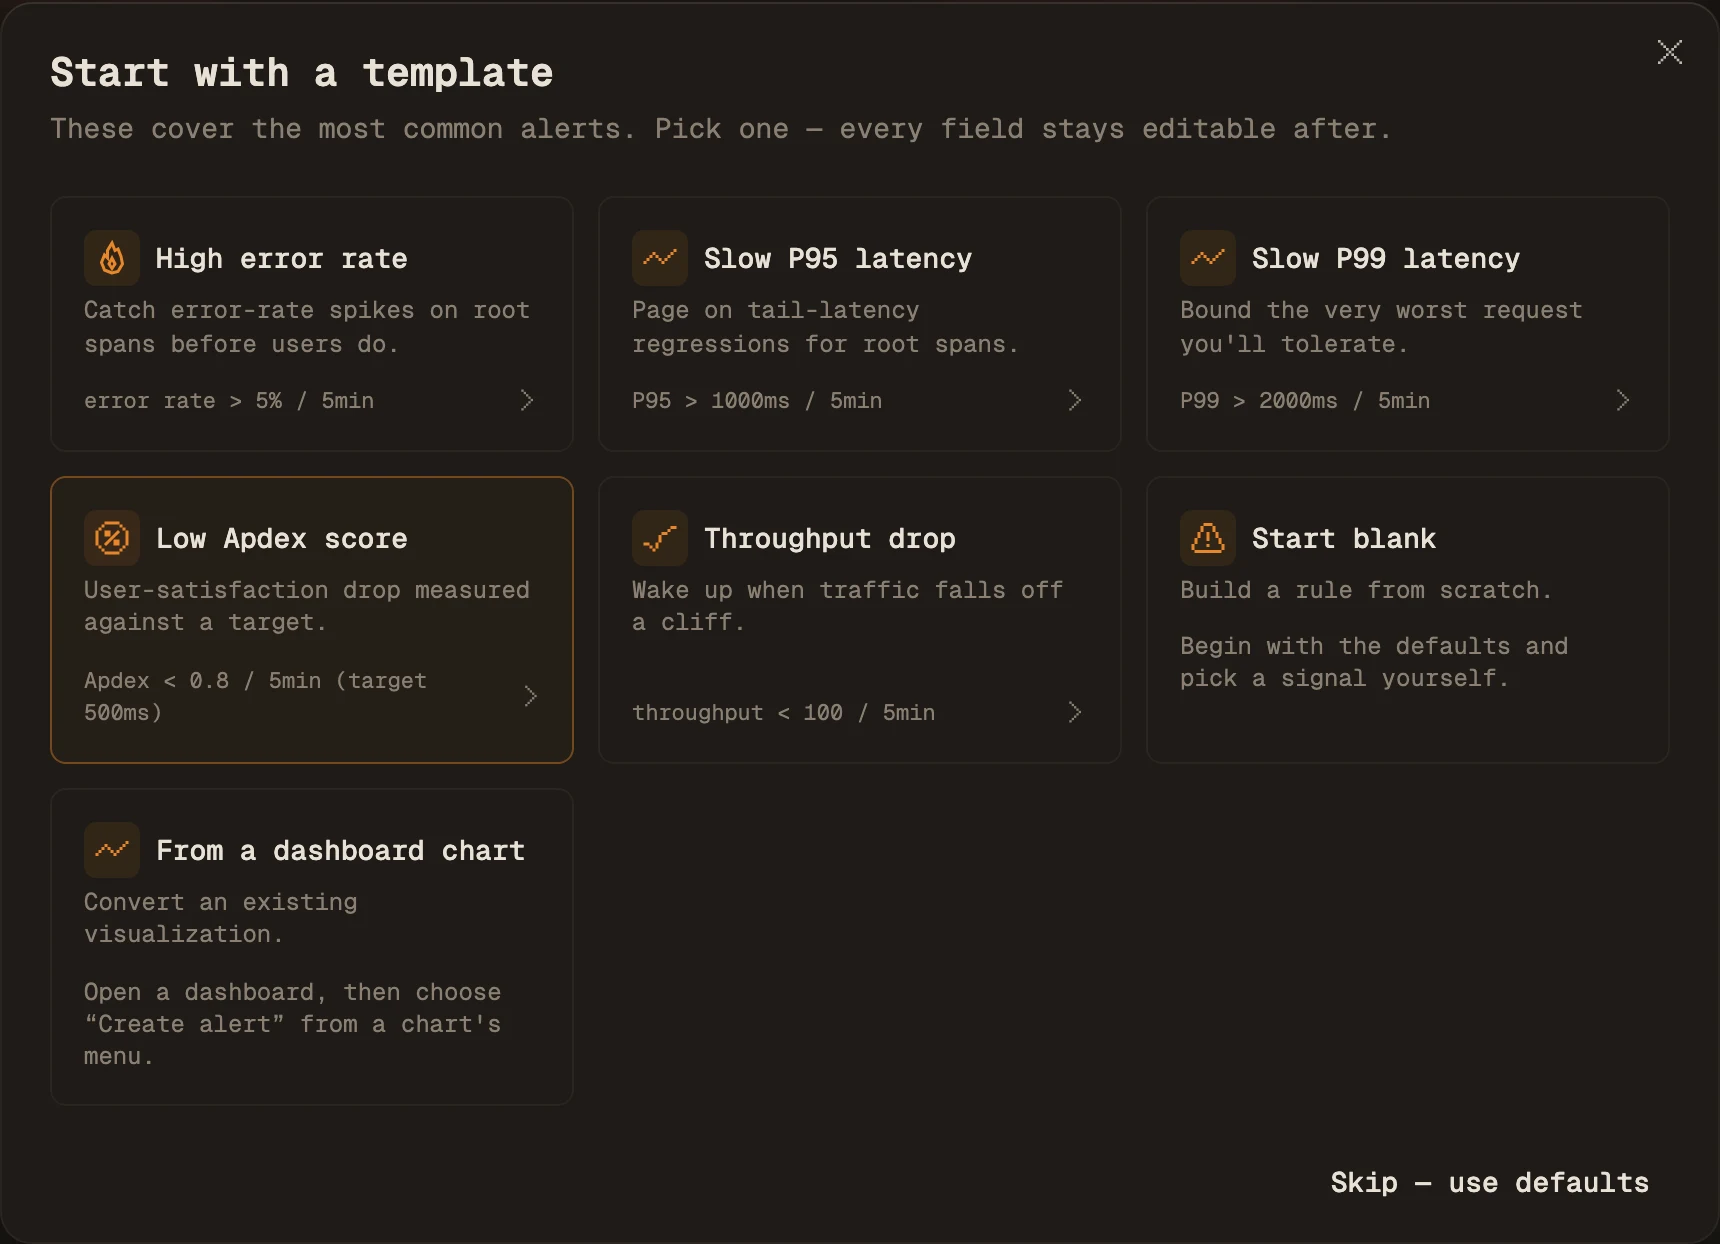
The rule builder opens on **Start with a template**. Pick <span class="hl-t">Low Apdex score</span> and every field below is filled: signal Apdex, target 500ms, fires below 0.8, five-minute window. Nothing is locked afterwards.
<figure class="shot">
  <img src="/screenshots/docs/apdex-01-template.webp" alt="The Start with a template dialog in Maple's rule builder, with the Low Apdex score template reading “Apdex < 0.8 / 5min (target 500ms)”." loading="lazy" />
  <figcaption>The Low Apdex score template. Every value it sets stays editable.</figcaption>
</figure>

### 2. Set the target, then the score you defend

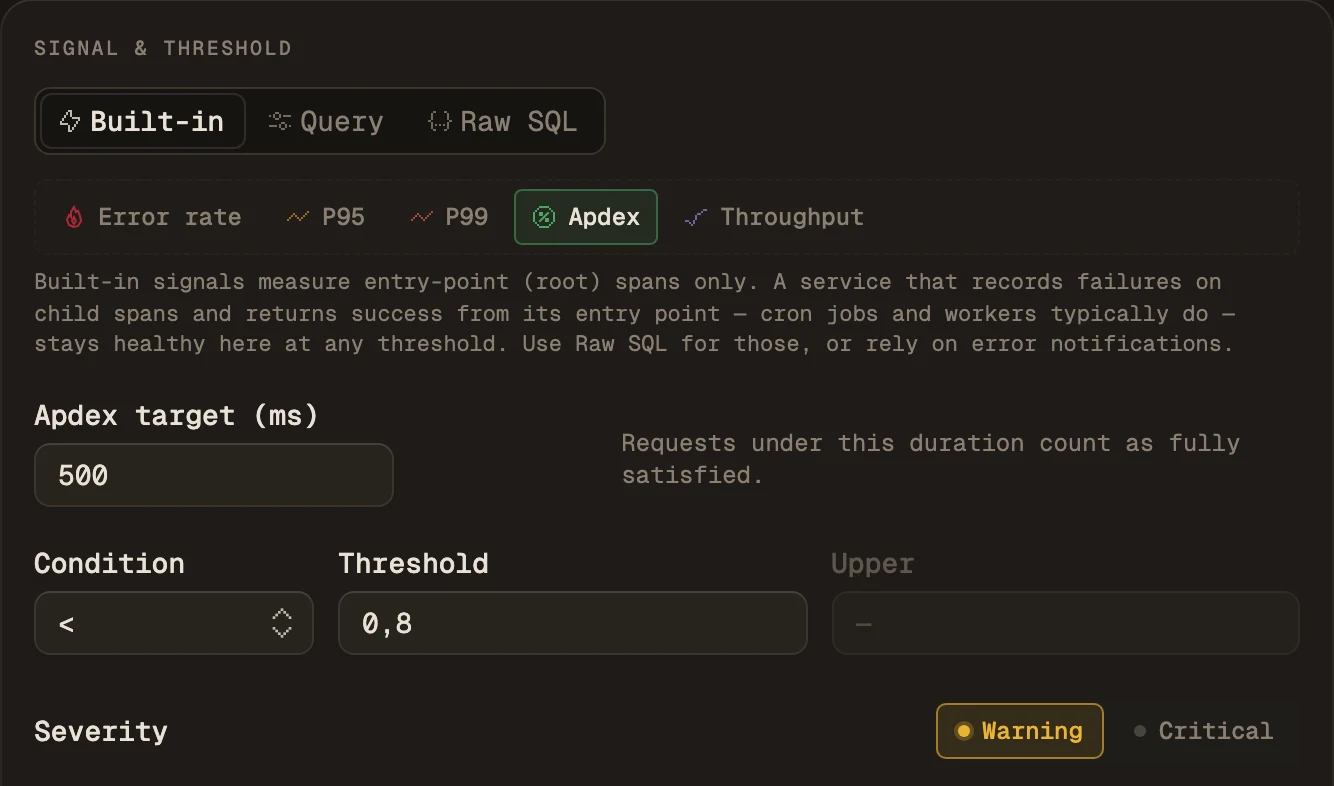
<span class="hl-t">Apdex target (ms)</span> is your T: requests under it count as <span class="hl-ok">fully satisfied</span>, and the <span class="hl-bad">frustrated</span> line follows automatically at 4T. Then set **Condition** to `<` and **Threshold** to the score worth paging for, typically `0.8`.

The panel also states the measurement boundary: built-in signals read entry-point spans only. A service that swallows failures on child spans and returns success from its entry point stays healthy here at any threshold. Use a **Query** or **Raw SQL** rule for that case.

<figure class="shot">
  <img src="/screenshots/docs/apdex-02-signal.webp" alt="The Signal & threshold panel with the Apdex chip selected, Apdex target 500 ms, condition less-than, threshold 0.8 and severity Warning." loading="lazy" />
  <figcaption>Apdex target 500&nbsp;ms, condition <code>&lt;</code>, threshold 0.8. (The decimal comma is the browser's locale, not a Maple setting.)</figcaption>
</figure>

### 3. Scope it

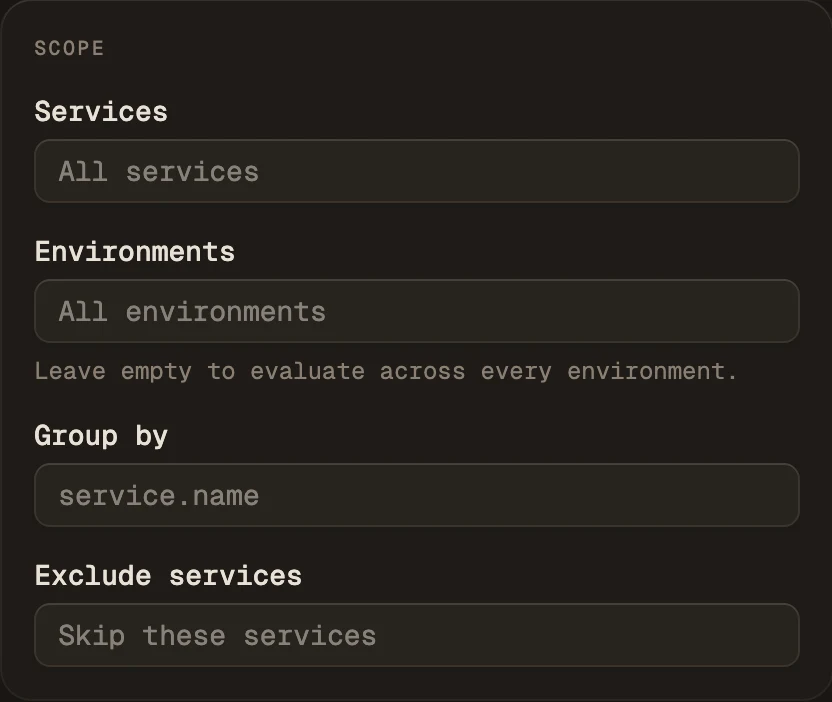
One T fits one class of traffic. If a rule covers many services or routes, set **Group by** to `service.name` or `attr.http.route` so each group is scored on its own and opens its own incident. Scope, grouping and the other fields shared by every signal are described in [Alert rules](/docs/alerting/alert-rules#scope).

<figure class="shot">
  <img src="/screenshots/docs/apdex-03-scope.webp" alt="The Scope panel of the rule builder, with Services, Environments, Group by and Exclude services fields." loading="lazy" />
  <figcaption>Scope and grouping. Empty means every service and every environment.</figcaption>
</figure>

### 4. Window, timing, destinations

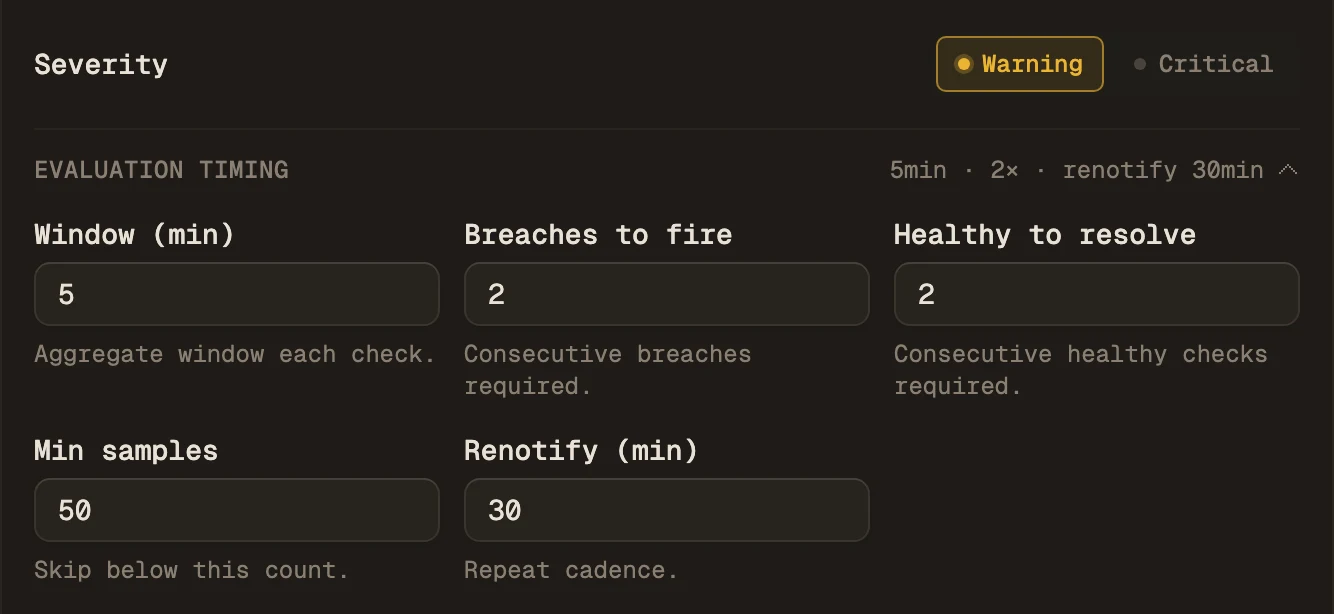
Five minutes is the default window. Short windows on low-traffic services are noisy for Apdex in particular, because a handful of slow requests moves the ratio a long way. Keep **Min samples** at 50 or higher, and raise it on low-traffic services, so a service with 4 requests at 3am cannot post a score of 0.5 and page someone.

<figure class="shot">
  <img src="/screenshots/docs/apdex-04-timing.webp" alt="The severity toggle set to Warning, and the expanded evaluation timing row: window 5 minutes, 2 breaches to fire, 2 healthy checks to resolve, minimum 50 samples, renotify every 30 minutes." loading="lazy" />
  <figcaption>Severity and evaluation timing. The defaults shown are the ones the template sets.</figcaption>
</figure>

An Apdex rule skips windows with no requests, so a service that goes quiet overnight does not read as a score of 0. The other timing fields (**Breaches to fire**, **Healthy to resolve**, **Renotify (min)**) work as on every rule. See [Evaluation timing](/docs/alerting/alert-rules#evaluation-timing).

Pick a **Severity**, attach your [notification destinations](/docs/alerting/notification-destinations), click **Test rule** to replay the rule over the past week, and save.

### Creating the same rule over the API

Every field in the form is a field on the API. `apdex_threshold_ms` is T in milliseconds. It defaults to 500 when omitted.

```bash
curl -X POST https://api.maple.dev/v2/alerts/rules \
  -H "Authorization: Bearer maple_ak_…" \
  -H "Content-Type: application/json" \
  -d '{
    "name": "Checkout Apdex below 0.8",
    "signal_type": "apdex",
    "apdex_threshold_ms": 500,
    "comparator": "lt",
    "threshold": 0.8,
    "window_minutes": 5,
    "service_names": ["checkout"],
    "environments": ["production"],
    "severity": "critical",
    "minimum_sample_count": 50,
    "consecutive_breaches_required": 2,
    "destination_ids": ["dest_oybbpTBhtSFGShMjjLiCrh"]
  }'
```

To see what the rule would have done over a past range before it can wake anyone, send the same object as `rule` to `POST /v2/alerts/rules/preview`, with `start_time` and `end_time`:

```json
{
	"rule": {
		"name": "Checkout Apdex below 0.8",
		"signal_type": "apdex",
		"apdex_threshold_ms": 500,
		"comparator": "lt",
		"threshold": 0.8,
		"window_minutes": 5,
		"service_names": ["checkout"],
		"severity": "critical",
		"destination_ids": ["dest_oybbpTBhtSFGShMjjLiCrh"]
	},
	"start_time": "2026-07-08T00:00:00.000Z",
	"end_time": "2026-07-15T00:00:00.000Z"
}
```

See [Alert rules](/docs/alerting/alert-rules#create-a-rule-over-the-api) and the [API reference](/docs/reference/api) for the full schema.

### Or hand it to an agent

You can also create the rule from an AI assistant. Connect Maple's [MCP server](/docs/reference/mcp) to any MCP client, then ask for the rule in plain language:

> Create an Apdex alert on the checkout service. Target 500ms, page me when the score drops below 0.8, and send it to the on-call Slack channel.

The agent builds the same rule you would build by hand. It cannot save an Apdex rule without a target, and it only sees your own organization's data.

After the rule exists, you can ask which of your Apdex rules would never fire, or why one paged last night. The agent reads the rule's checks and incidents to answer.

## Known limitations

- **Apdex is computed on sampled spans.** Under uniform sampling the score stays representative. A sampler that keeps slow or failed traces preferentially, without reporting its sampling weight, drags the score down. See [Sampling and throughput](/docs/concepts/sampling-throughput).
- **One T per rule.** A service whose `/healthz` and `/reports/export` share a rule is being measured against a target that fits neither. Group by `attr.http.route`, or write separate rules.
- **The score hides magnitude.** It counts frustrated requests without weighting how frustrated they were. Pair it with a p99 rule.

The [What is Apdex?](/guides/what-is-apdex) guide covers the formula, a worked example, what counts as a good score, and how Apdex compares to p95 and p99.