# Alert rules
Create an alert rule in Maple: pick a signal, scope it to services and environments, set the threshold and evaluation timing, attach destinations, and preview it against past data. In the app or over the API.
An **alert rule** watches one signal, checks it against a threshold every minute, and opens an [incident](/docs/alerting/incidents) when the threshold is crossed for long enough. Each incident notifies the [destinations](/docs/alerting/notification-destinations) attached to the rule.
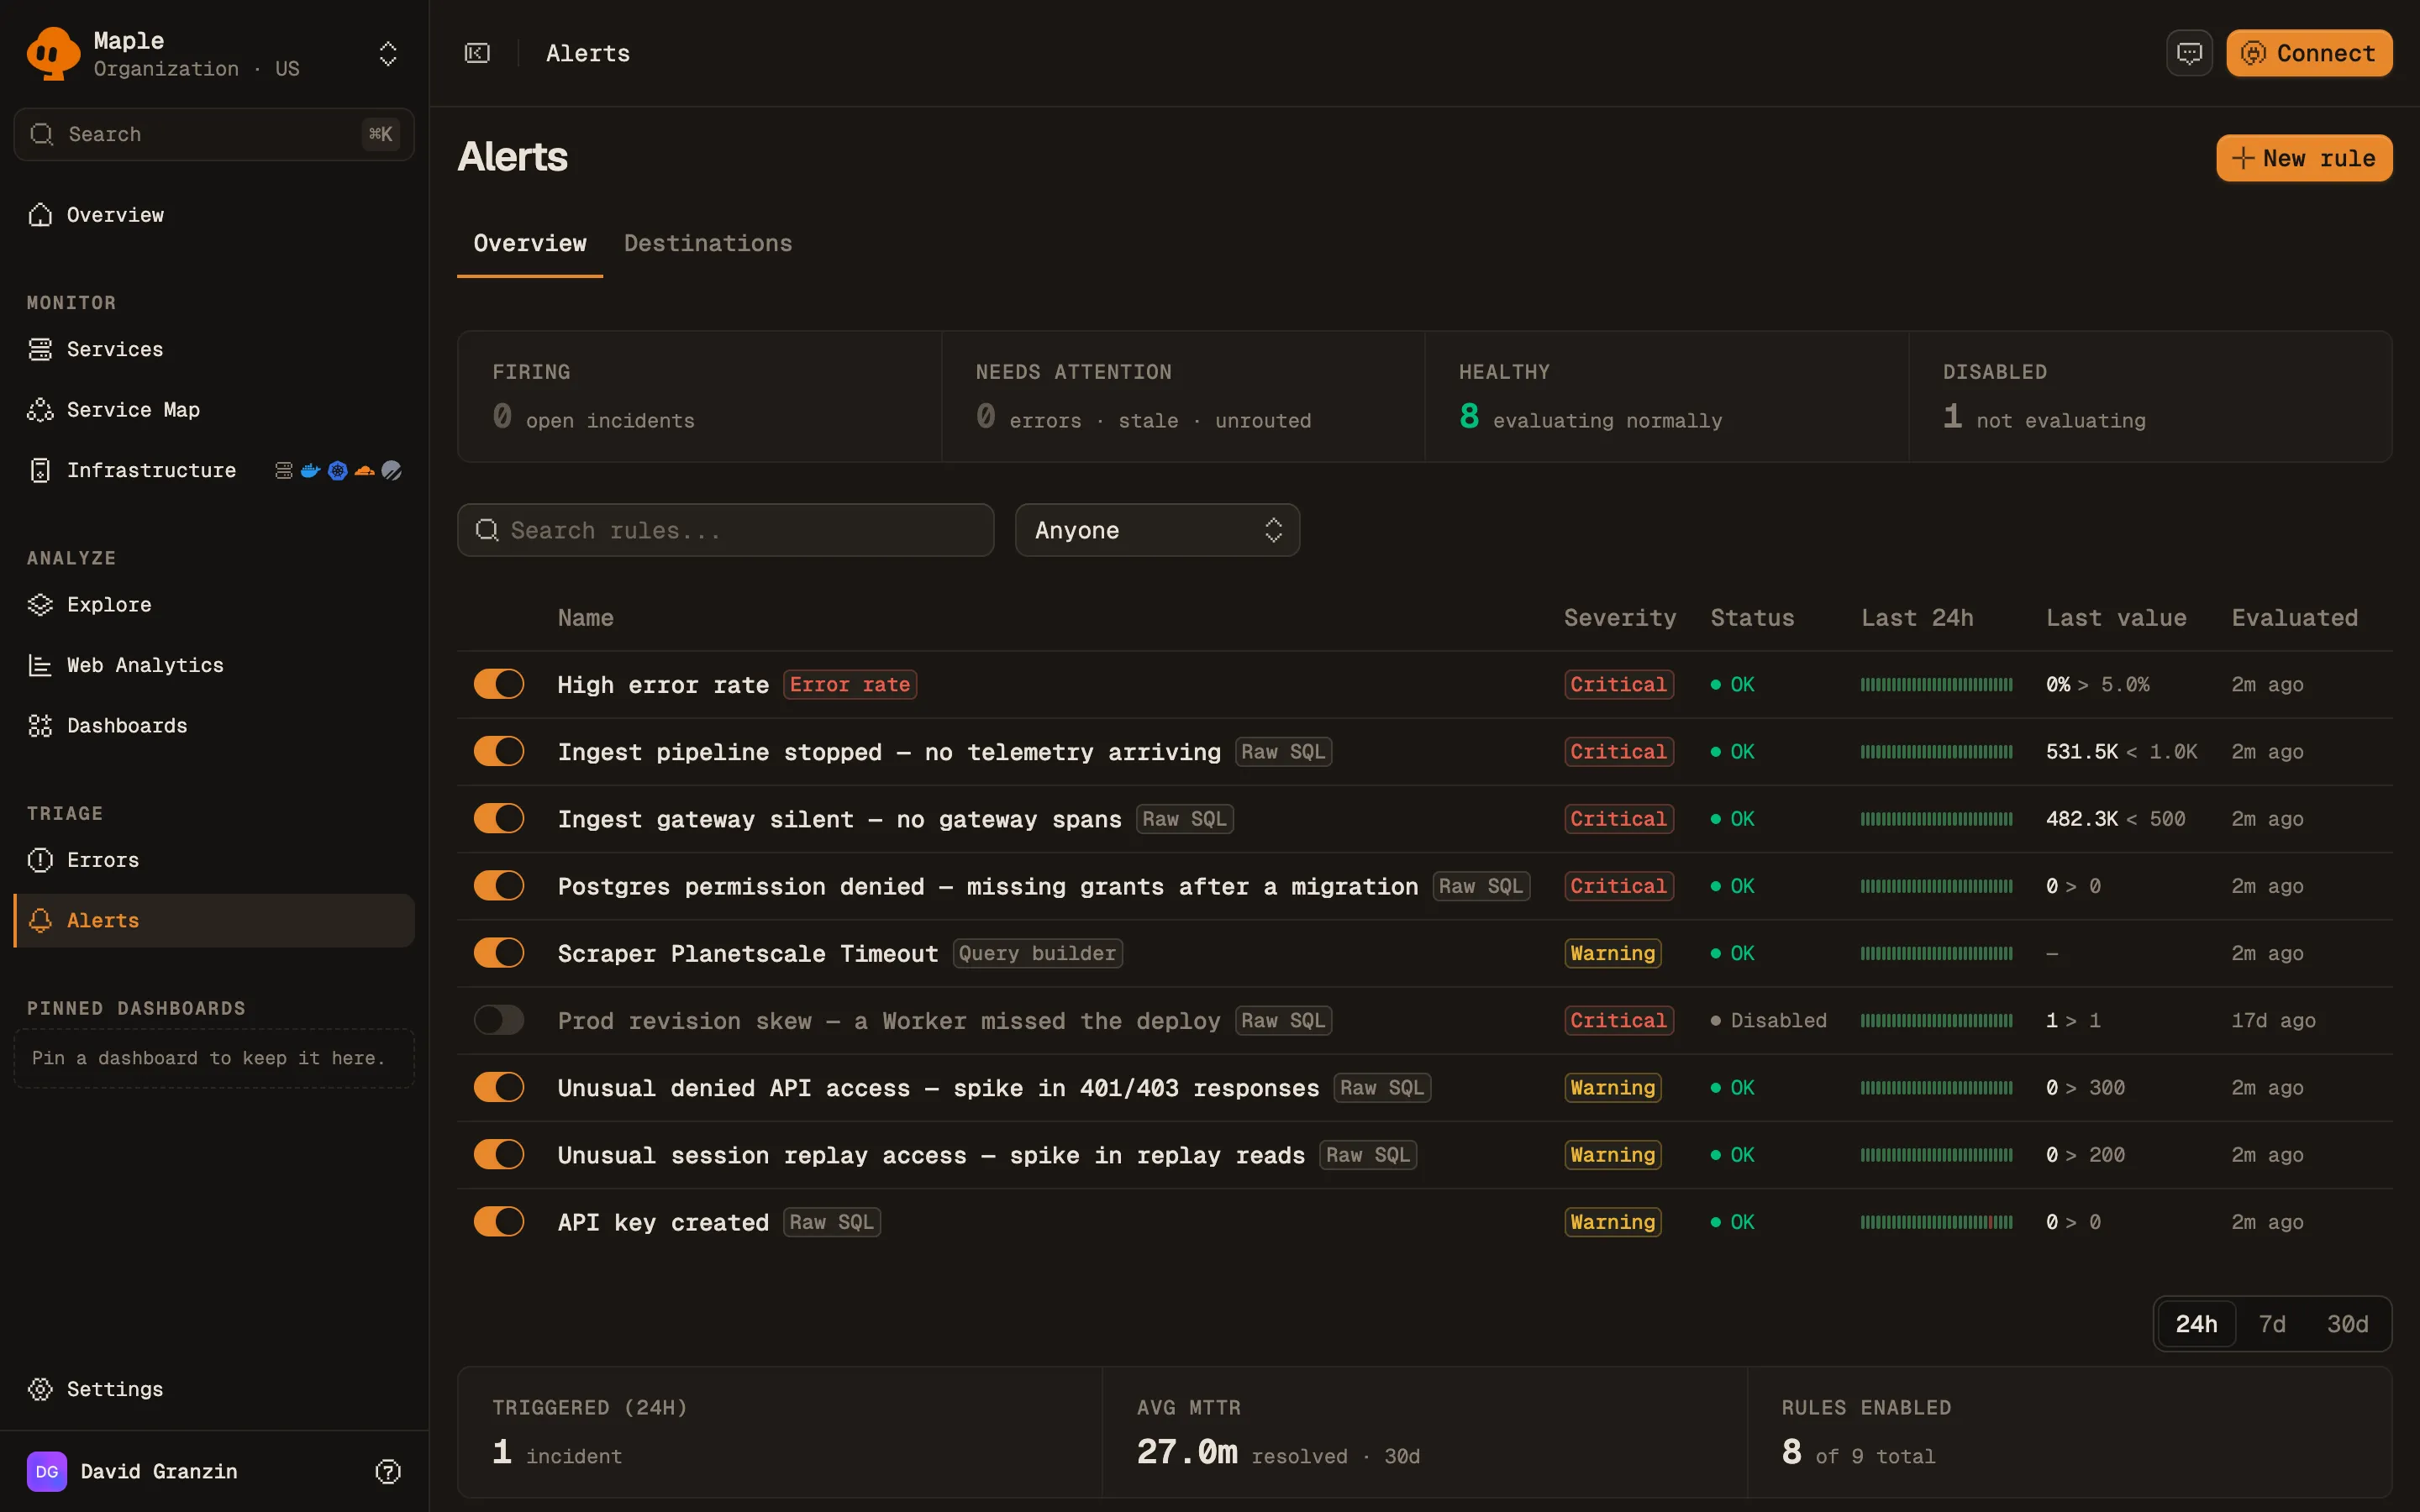
You manage rules on the **Alerts** page. Creating, editing and deleting rules requires the organization admin role.
The Alerts overview. The strip in each row shows the last 24 hours of checks.
## Prerequisites
- Telemetry arriving in Maple. Built-in signals read traces.
- At least one [notification destination](/docs/alerting/notification-destinations). A rule cannot be saved without one.
## Create a rule
1. Open **Alerts** and click **New rule**. To start from a service, open the service and click **Create Alert**, which fills in the scope.
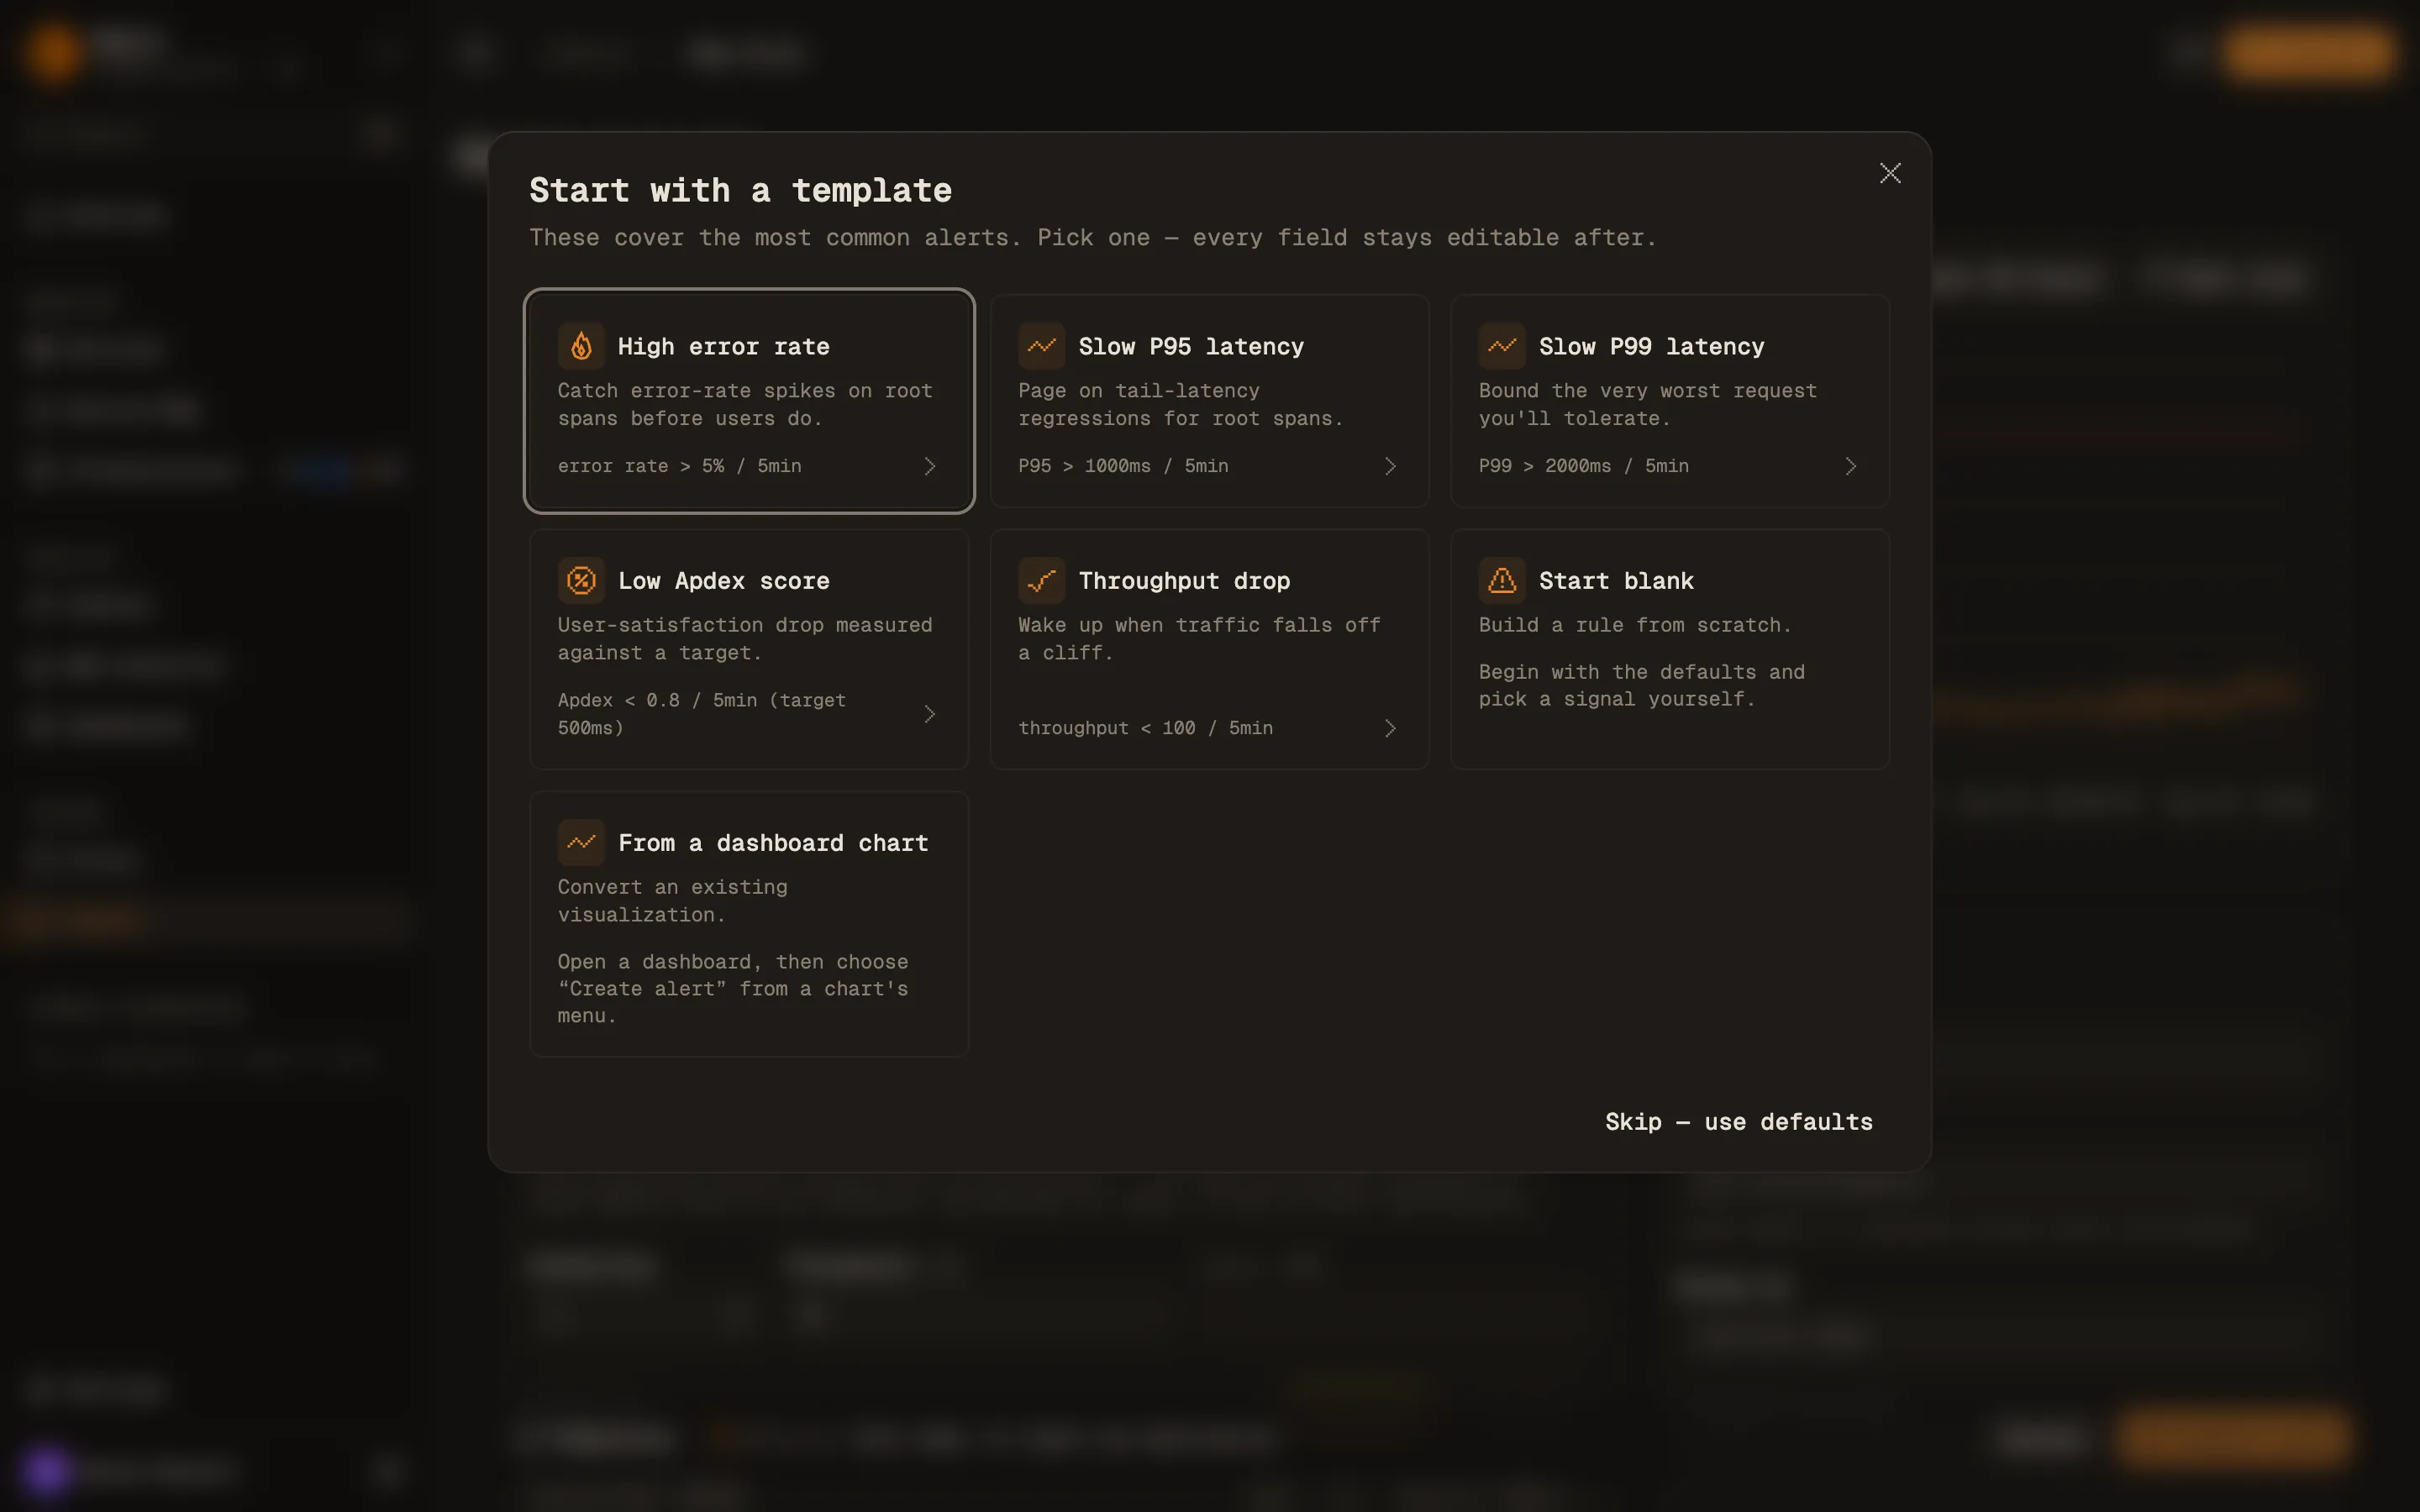
2. **Start with a template** opens first. Pick a template, **Start blank**, or **From a dashboard chart**. Every field a template sets stays editable.
3. Fill in **Signal & threshold**, **Scope**, **Notifications** and **Details**, described below.
4. Click **Test rule** to preview the rule against past data.
5. Click **Create rule**.
The template picker that opens when you create a rule.
The templates:
| Template | Signal | Fires when | Window | Also sets |
| ---------------- | ---------- | ------------------- | ------ | ------------------------------------------------ |
| High error rate | Error rate | above 5% | 5 min | **Group by** `service.name` when no scope is set |
| Slow P95 latency | P95 | above 1000 ms | 5 min | |
| Slow P99 latency | P99 | above 2000 ms | 5 min | |
| Low Apdex score | Apdex | below 0.8 (T 500ms) | 5 min | |
| Throughput drop | Throughput | below 100 | 5 min | **Min samples** 0 |
## Signals
The signal kind is **Built-in**, **Query** or **Raw SQL**.
**Built-in** signals read the entry-point spans of each service: server and consumer spans, and trace roots. That is the same set of requests the service pages chart.
| Signal | API `signal_type` | Value compared against the threshold |
| ---------- | ----------------- | ------------------------------------------------------------------------------------------------------------ |
| Error rate | `error_rate` | Share of requests with status `Error`. Entered as a percent in the app, a 0 to 1 ratio in the API. |
| P95 | `p95_latency` | 95th percentile duration, in milliseconds. |
| P99 | `p99_latency` | 99th percentile duration, in milliseconds. |
| Apdex | `apdex` | Apdex score from 0 to 1, against the **Apdex target (ms)**. See [Apdex alerts](/docs/alerting/apdex-alerts). |
| Throughput | `throughput` | Estimated number of requests in the window. |
Counts and rates are weighted for sampling. See [Sampling and throughput](/docs/concepts/sampling-throughput).
A built-in signal only sees entry-point spans. A service that records a failure on a child span and still returns success from its entry point stays healthy on these signals. Use a **Query** or **Raw SQL** rule for that case.
**Query** (`builder_query`) uses the same query builder as dashboard charts. It can read traces, logs, metrics or product events, with its own filters and group-by. The quickest way to build one is from a chart: open a dashboard, open the chart's menu and choose **Create alert**.
**Raw SQL** (`raw_query`) runs your own SQL. The query must include `$__orgFilter` and a `$__timeFilter(...)` on the time column, and return a time bucket and a value. **Reduce buckets by** turns the buckets in the window into one value: **Last bucket**, **Sum**, **Average**, **Minimum** or **Maximum**. To evaluate several groups, return a group column. Return a `samples` column with the number of events behind each row: **Min samples** sums it, and without it every row counts as one sample, so the minimum counts buckets rather than events. See the [SQL reference](/docs/reference/sql).
For **Query** and **Raw SQL** rules the query carries its own filters, so the **Scope** section is hidden.
## Threshold
**Condition** is one of `>`, `>=`, `<`, `<=`, `=`, `!=`, `between` or `not between`. The range conditions use **Lower** and **Upper**. **Threshold** is the value the signal is compared against.
**Severity** is **Warning** or **Critical**. It is shown on the incident and in every notification.
## Scope
Scope applies to built-in signals.
- **Services.** Empty means every service. When you pick more than one service, Maple evaluates each service on its own and opens a separate incident per service.
- **Environments.** Empty means every environment. Otherwise the rule only counts spans from the listed deployment environments (`deployment.environment.name`).
- **Group by.** With no services selected, a group-by such as `service.name` or an attribute like `attr.http.route` evaluates each group on its own. You get one incident per group that breaches, instead of one blended value that may never cross the threshold.
- **Exclude services.** Skips named services. It needs **Group by** set to `service.name` and no services selected.
## Evaluation timing
Maple evaluates every enabled rule once a minute. Each check aggregates the last **Window (min)** minutes, so a 5-minute window is a rolling 5 minutes re-scored every 60 seconds.
**Evaluation timing** is collapsed to a summary line (for example `5min · 2× · renotify 30min`) until you open it:
| Field | App default | API field | API default | What it does |
| ------------------ | ----------- | ------------------------------- | ----------- | ------------------------------------------------------------------- |
| Window (min) | 5 | `window_minutes` | required | Length of the window each check aggregates. 1 to 1440 minutes. |
| Breaches to fire | 2 | `consecutive_breaches_required` | 2 | Consecutive breaching checks before an incident opens. |
| Healthy to resolve | 2 | `consecutive_healthy_required` | 2 | Consecutive healthy checks before an incident resolves. |
| Min samples | 50 | `minimum_sample_count` | 0 | A check with fewer samples than this is skipped. |
| Renotify (min) | 30 | `renotify_interval_minutes` | 30 | How often an open incident notifies again while it keeps breaching. |
A skipped check counts neither as a breach nor as healthy. It leaves the breach and healthy counters where they were.
A window with no data at all is skipped, with two exceptions: a rule with **Alert when there is no data** on (`alert_on_no_data`) counts it as a breach, and otherwise a **Throughput** rule with `<` or `<=` treats it as zero. Turn the switch on for **Raw SQL** rules, where a query that stops matching otherwise goes quiet instead of firing. It is not available on grouped rules: a group that stops reporting keeps its open incident until its telemetry returns. On a **Raw SQL** rule that returns a group column, it fires only when the query returns no rows at all.
The **Min samples** check runs before the threshold comparison, and that zero still counts as zero samples. For **Throughput** the sample count is the signal, so a drop rule with the blank form's default of 50 skips every window below 50 requests, including a full outage, and cannot fire for those windows. Set **Min samples** to 0 for throughput drop rules, as the **Throughput drop** template does. Then traffic stopping entirely fires the rule.
Short windows on low-traffic services are noisy, because a few slow or failed requests move the value a long way. Raise **Min samples** or widen the window for those services.
## Notifications
Pick one or more destinations in **Notifications**. **Send test** delivers a test notification for this rule to the selected destinations.
**Message template** customizes the title and Markdown body of Slack, Discord, Telegram and PagerDuty notifications with `{{ variable }}` substitution, for example `{{ rule.name }}`, `{{ value }}` or `{{ links.app }}`. Leave it blank for the built-in format. Email, webhook and Hazel destinations always use the built-in format.
## Details
**Rule name** is required. **Tags** (up to 20, each up to 32 characters) group and filter rules and incidents on the Alerts page. **Notes** are free text shown with the rule.
## Preview a rule
The chart at the top of the form replays the rule over a past time range. Pick the range and click **Test rule**. The chart shows the value for each window, the threshold, and shaded spans where the rule would have held an incident open. The badge reads **Would trigger** or **Within threshold** for the latest window.
The preview sends nothing. Use it to check that a threshold would not have fired all week, or would have caught last Tuesday's incident.
## Create a rule over the API
Rules are available at `/v2/alerts/rules` on `https://api.maple.dev` (`https://api.eu.maple.dev` for EU organizations). Use an API key (`maple_ak_…`) from **Settings → API Keys**. Creating, updating, deleting and testing a rule requires the `alerts:write` scope and the org admin role.
```bash
curl -X POST https://api.maple.dev/v2/alerts/rules \
-H "Authorization: Bearer maple_ak_…" \
-H "Content-Type: application/json" \
-d '{
"name": "Checkout error rate",
"signal_type": "error_rate",
"comparator": "gt",
"threshold": 0.05,
"window_minutes": 5,
"service_names": ["checkout"],
"environments": ["production"],
"severity": "critical",
"minimum_sample_count": 50,
"destination_ids": ["dest_oybbpTBhtSFGShMjjLiCrh"]
}'
```
Error rate thresholds are 0 to 1 ratios in the API (`0.05` is 5%). `destination_ids` must name at least one existing destination.
To preview a rule over a past range, `POST /v2/alerts/rules/preview` with the rule under `rule` and the range in `start_time` and `end_time`. It needs the `alerts:read` scope and sends nothing.
```bash
curl -X POST https://api.maple.dev/v2/alerts/rules/preview \
-H "Authorization: Bearer maple_ak_…" \
-H "Content-Type: application/json" \
-d '{
"rule": {
"name": "Checkout error rate",
"signal_type": "error_rate",
"comparator": "gt",
"threshold": 0.05,
"window_minutes": 5,
"service_names": ["checkout"],
"severity": "critical",
"destination_ids": ["dest_oybbpTBhtSFGShMjjLiCrh"]
},
"start_time": "2026-07-14T00:00:00.000Z",
"end_time": "2026-07-15T00:00:00.000Z"
}'
```
The response lists the value and status of each window per group in `series`, and the spans where an incident would have been open in `would_fire`.
`POST /v2/alerts/rules/test` evaluates a rule once against current data. Set `send_notification` to `true` to also deliver a test notification. See the [API reference](/docs/reference/api) for every endpoint and field.
## Troubleshooting
- **The rule never fires.** Open the rule and look at its checks. If every check is skipped, each one says why: **no data** means the scope or query matches nothing, **below min samples** means the window has fewer samples than **Min samples**. Check the service names and environments against what is arriving.
- **The rule fires and resolves over and over.** Raise **Breaches to fire** and **Healthy to resolve**, or widen the window.
- **Save is disabled.** The action bar lists what is missing, such as a rule name or a destination.
## Next steps
- [Incidents](/docs/alerting/incidents): what happens after a rule fires.
- [Apdex alerts](/docs/alerting/apdex-alerts): choosing the target and threshold for an Apdex rule.
- [Uptime monitoring](/docs/alerting/uptime-monitoring): availability alerts from traces, and HTTP checks from the OpenTelemetry Collector.
- [Notification destinations](/docs/alerting/notification-destinations): where notifications go.